Reactive Big Data on OpenShift In-Memory Data Grids

Reactive Big Data on OpenShift In-Memory Data Grids
Thanks a lot to everyone who attended the Infinispan sessions I gave in Great Indian Developer Summit! Your questions after the talks were really insightful.
One of the talks I gave was titled Big Data In Action with Infinispan (slides are available here), where I was looking at how Infinispan based in-memory data grids can help you deal with the problems of real-time big data and how to do big data analytics.
During the talk I live coded a demo showing both real-time and analytics parts, running on top of OpenShift and using Vert.x for joining the different parts. The demo repository contains background information on instructions to get started with the demo, but I thought it’d be useful to get focused step-by-step instructions in this blog post.
Set Up
Before we start with any of the demos, it’s necessary to run some set up steps:
-
Check out git repository:
git clone https://github.com/galderz/swiss-transport-datagrid
-
Install OpenShift Origin or Minishift to get an OpenShift environment running in your own
        machine. I decided to use OpenShift Origin, so the instructions
below are tailored for that
        environment, but similar instructions could be used with
Minishift.
-
Install Anaconda for Python 3, this is required to run Jupyter notebook for plotting.
Demo Domain
Once the set up is complete, it’s time to talk about the demos before we run them.
Both demos shown below work with the same application domain: swiss rail transport systems. In this domain, we differentiate between physical stations, trains, station boards which are located in stations, and finally stops, which are individual entries in station boards.
Real Time Demo
The first demo is about working with real-time data from station boards around the country and presenting a centralised dashboard of delayed trains around the country. The following diagrams shows how the following components interact with each other to achieve this:
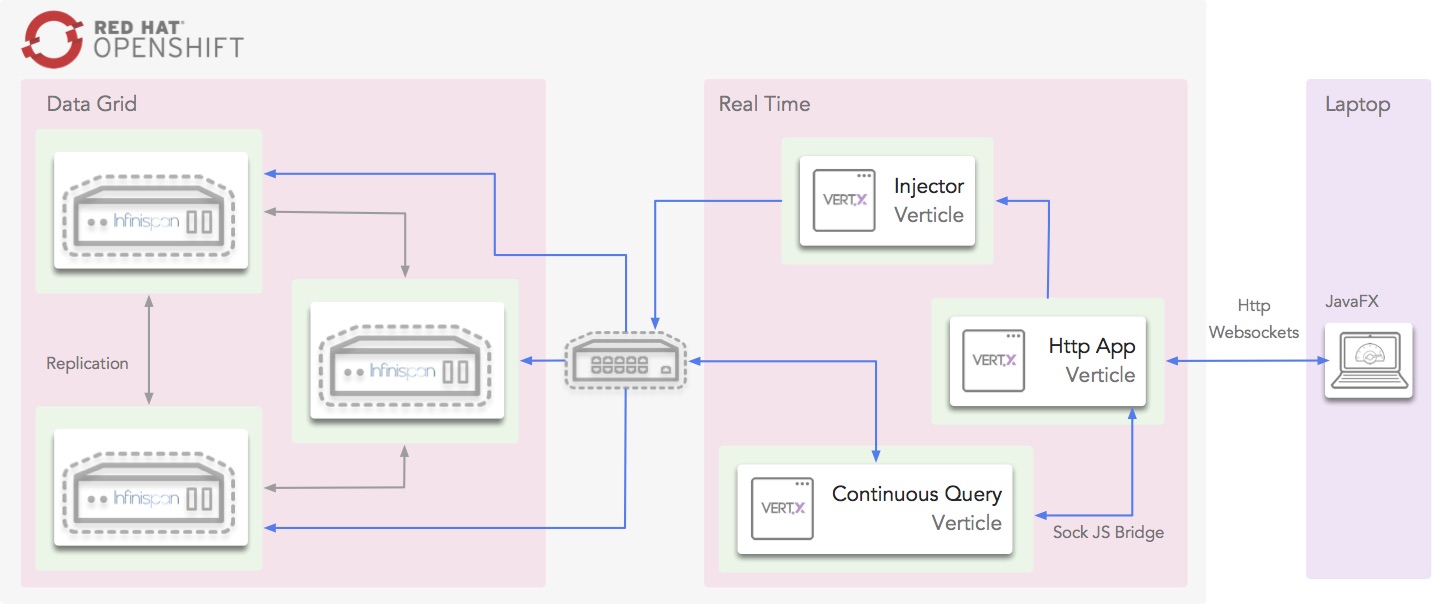
Infinispan, which provides the in-memory data grid storage, and Vert.x, which provides the glue for the centralised delayed dashboard to interact with Infinispan, all run within OpenShift cloud.
Within the cloud, the Injector verticle cycles through station board data and injects it into Infinispan. Also within the cloud, a Vert.x verticle that uses Infinispan’s Continuous Query to listen for station board entries that are delayed, and these are pushed into the Vert.x event bus, which in turn, via a SockJS bridge, get consumed via WebSockets from the dashboard. The centralised dashboards is written with JavaFX and runs outside the cloud.
To run the demo, do the following:
-
Start OpenShift Origin if you’ve not already done so:
oc cluster up --public-hostname=127.0.0.1
-
Deploy all the OpenShift cloud components:
cd ~/swiss-transport-datagrid
./deploy-all.sh
3. Open the OpenShift console and verify that all pods are up.
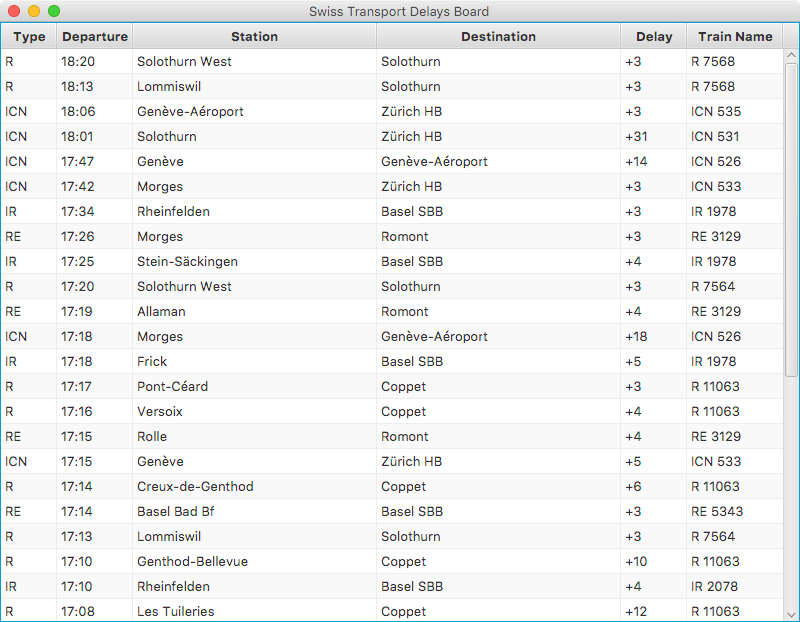
4. Load github repository into your favourite IDE and run
delays.query.continuous.fx.FxApp Java FX application. This will load the
centralised dashboard. Within seconds delayed trains will start appearing. For example:
Analytics Demo
The first demo is focused on how you can use Infinispan for doing offline analytics. In particular, this demo tries to answer the following question:
Q. What is the time of the day when there is the biggest ratio of delayed trains?
Once again, this demo runs on top of OpenShift cloud, uses Infinispan as in-memory data grid for storage and Vert.x for glueing components together.
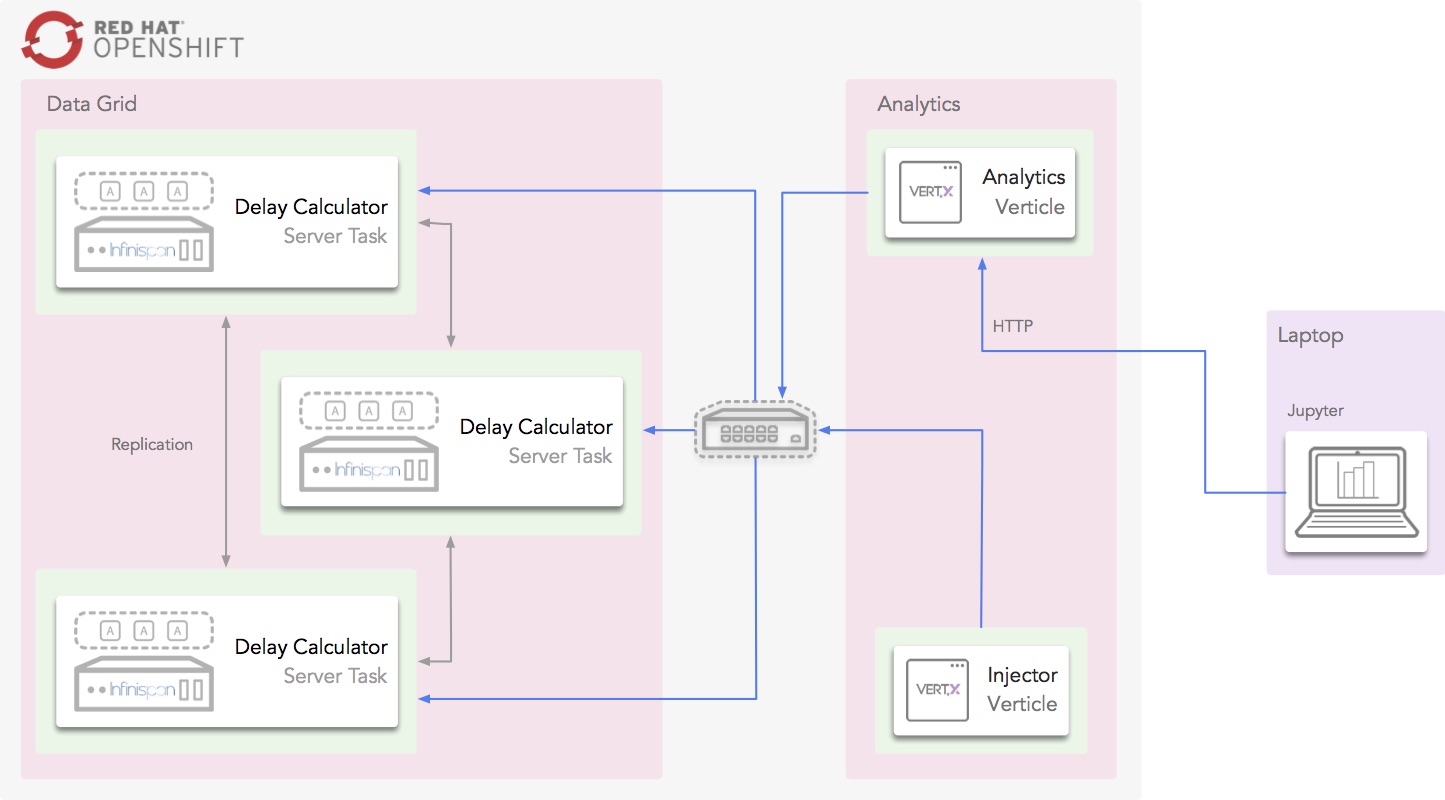
To answer this question, Infinispan data grid will be loaded with 3 weeks worth of data from station boards using a Vert.x verticle. Once the data is loaded, the Jupyter notebook will invoke an HTTP restful endpoint which will invoke an Vert.x verticle called AnalyticsVerticle.
This verticle will invoke a remote server task which will use Infinispan Distributed Java Streams to calculate the two pieces of information required to answer the question: per hour, how many trains are going through the system, and out of those, how many are delayed.
An important aspect to bear in mind about this server tasks is that it will only be executed in one of the nodes in the cluster. It does not matter which one. In turn, this node will will ship the lambdas required to do the computation to each of the nodes so that they can executed against their local data. The other nodes will reply with the results and the node where the server task was invoked will aggregate the results.
The results will be sent back to the originating invoker, the Jupyter notebook which will plot the results. The following diagrams shows how the following components interact with each other to achieve this:
Here is the demo step-by-step guide:
1. Start OpenShift Origin and deploy all components as shown in previous demo.
2. Start the Jupyter notebook:
cd ~/swiss-transport-datagrid/analytics/analytics-jupyter
~/anaconda/bin/jupyter notebook
3. Once the notebook opens, click open live-demo.ipynb notebook and execute each of the cells in order. You should end up seeing a plot like this:
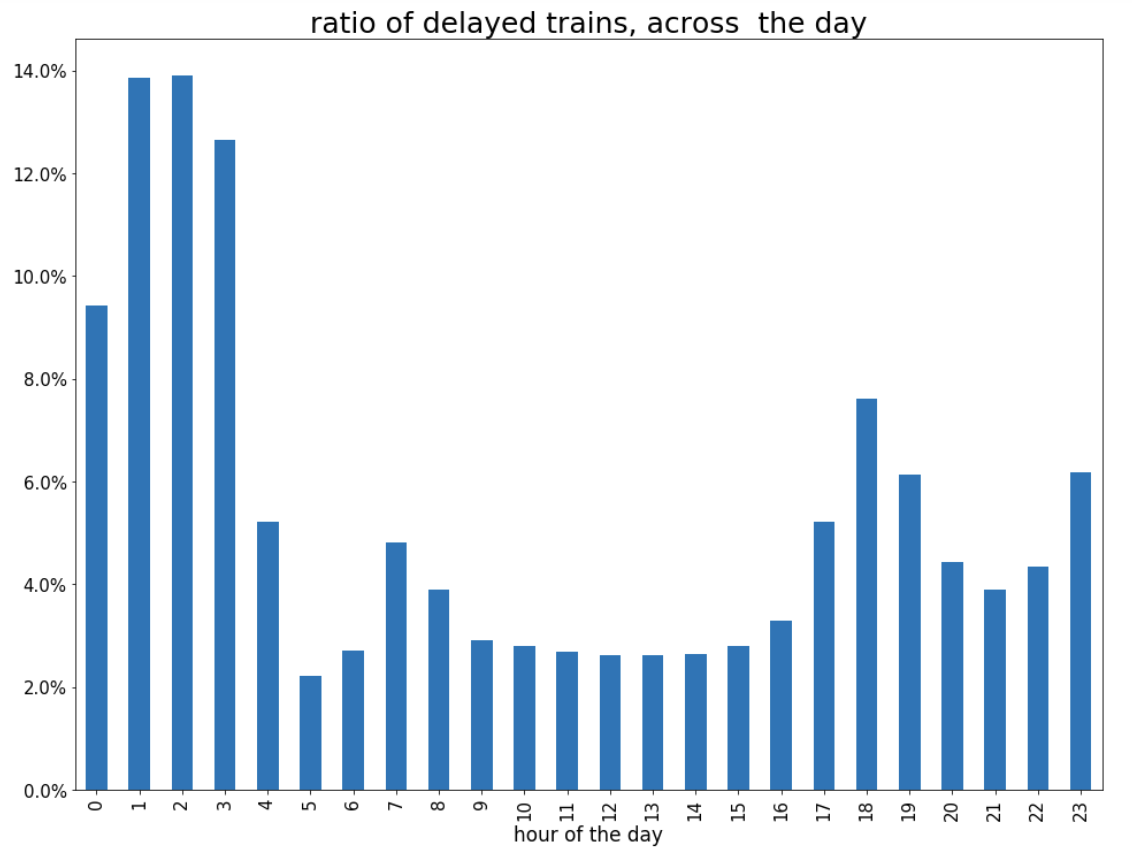
So, the answer to the question:
Q. What is the time of the day when there is the biggest ratio of delayed trains?
https://www.blogger.com/blogger.g?blogID=5717179571414330874https://www.blogger.com/blogger.g?blogID=5717179571414330874[]https://www.blogger.com/blogger.g?blogID=5717179571414330874
is 2am! That’s because last connecting trains of the day wait for each other to avoid leaving passengers stranded.
Conclusion
This has been a summary of the demos that I presented at Great Indian Developer Summit with the intention of getting you running these demos as quickly as possible. The repository contains more detailed information of these demos. If there’s anything unclear or any of the instructions above are not working, please let us know!
Once again, a very special thanks to Alexandre Masselot for being the inspiration for these demos. Merci @Alex!!
Over the next few months we will be enhancing the demo and hopefully we’ll be able to do some more live demonstrations at other conferences.
Cheers,
Galder
Get it, Use it, Ask us!
We’re hard at work on new features, improvements and fixes, so watch this space for more announcements!Please, download and test the latest release.
The source code is hosted on GitHub. If you need to report a bug or request a new feature, look for a similar one on our GitHub issues tracker. If you don’t find any, create a new issue.
If you have questions, are experiencing a bug or want advice on using Infinispan, you can use GitHub discussions. We will do our best to answer you as soon as we can.
The Infinispan community uses Zulip for real-time communications. Join us using either a web-browser or a dedicated application on the Infinispan chat.

