Infinispan 15 tracing news

In the previous version of Infinispan we introduced the OpenTelemetry Tracing capability. With the new version we evolved the integration in order to:
-
configure it both globally and per-cach using the standard Infinispan configuration.
-
trace more event types: cluster, cross-site, cache-store and security.
-
select and configure, even at runtime, the span types that we want to produce and send to the collector.
The source code featured in this blog post has been taken from this demo project.
Configure tracing
Global configuration
We enable tracing globally by defining a collector-endpoint as usual. Instead of relying on a system property,
we can now do it directly in the Infinispan Server Configuration:
<infinispan xmlns:server="urn:infinispan:server:15.0">
   <cache-container name="default">
      <tracing collector-endpoint="http://jaeger-collector.infinispan-15-tracing.svc.cluster.local:4318" security="true" service-name="infinispan-service-tracing" />
   </cache-container>
</infinispan>
By default, we now support tracing using the OpenTelemetry Protocol (OTLP) with the default exporter protocol as http/protobuf, instead of grpc.
The default Jaeger port using this combination is the 4318.
We’ve also activated tracing for security audits. This is a new tracing category introduced with Infinispan 15, and it’s defined at the cache manager level.
infinispan:
 cacheContainer:
   tracing:
     collector-endpoint: "http://jaeger-collector.infinispan-15-tracing.svc.cluster.local:4318"
     service-name: infinispan-service-tracing
     security: true
Cache configuration
Cache-scoped tracing categories must be configured in the cache configuration. Here’s an example of a cache configuration that enables tracing for additional categories:
replicatedCache:
  encoding:
    key:
      mediaType: "application/x-protostream"
    value:
      mediaType: "application/x-protostream"
  indexing:
    enabled: "true"
    storage: "local-heap"
    startupMode: "NONE"
    indexedEntities:
      - "fax.play.image"
  tracing:
    enabled: true
    categories:
      - "container"
      - "persistence"
      - "cluster"
      - "x-site"
In the above example, container, persistence, cluster and x-site (cross-site replication) are enabled.
In the absence of category specification, container tracing is enabled by default.
Runtime operations
Furthermore, it is possible to enable / disable tracing categories, or even the entire tracing subsystem at runtime, using either the Hot Rod client or the REST API.
The following example enables tracing for the container and persistence categories while disabling any other previously enabled categories:
Set<String> enabledCategories = Set.of("container", "persistence");
cacheManager.administration()
   .updateConfigurationAttribute(cache.getName(), "tracing.categories", String.join(",", enabledCategories));
Tracing in action
Now that we have the setup. Let’s see some example of tracing in action. If we open the Jaeger console we can see immediately some security audit events logged.
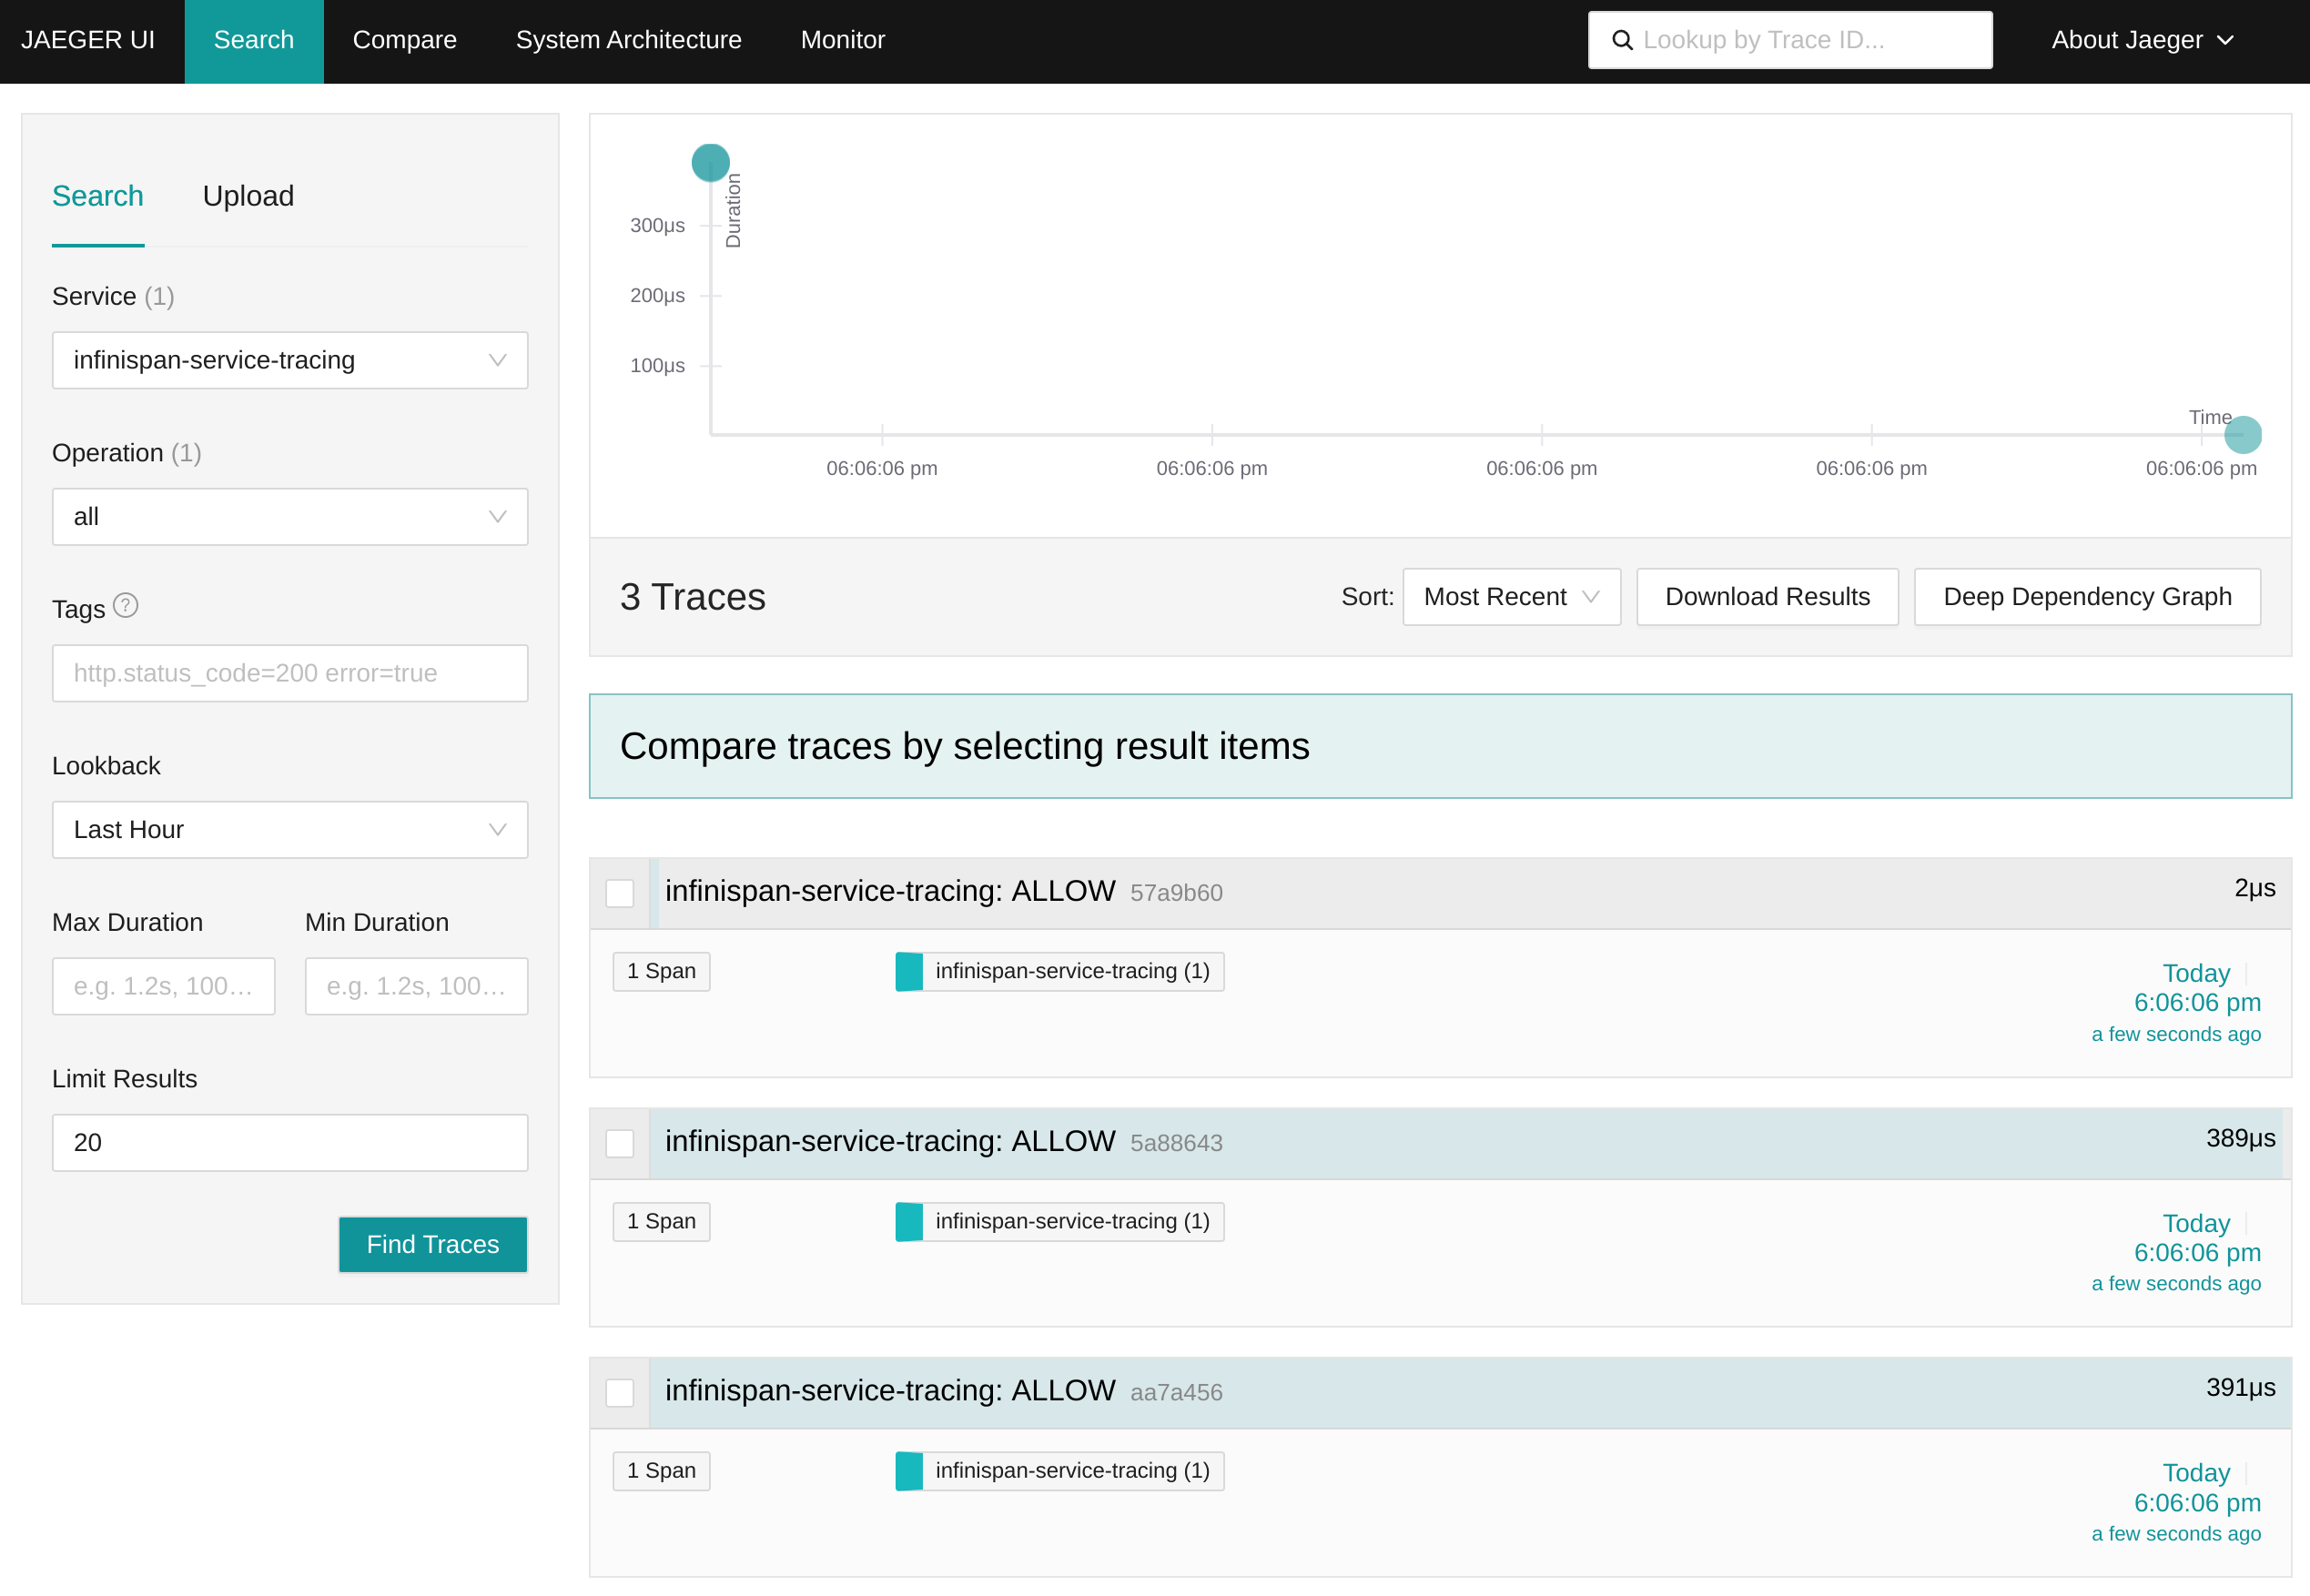
At startup, only container tracing is enabled. After some interaction, we might see a log similar to the following:
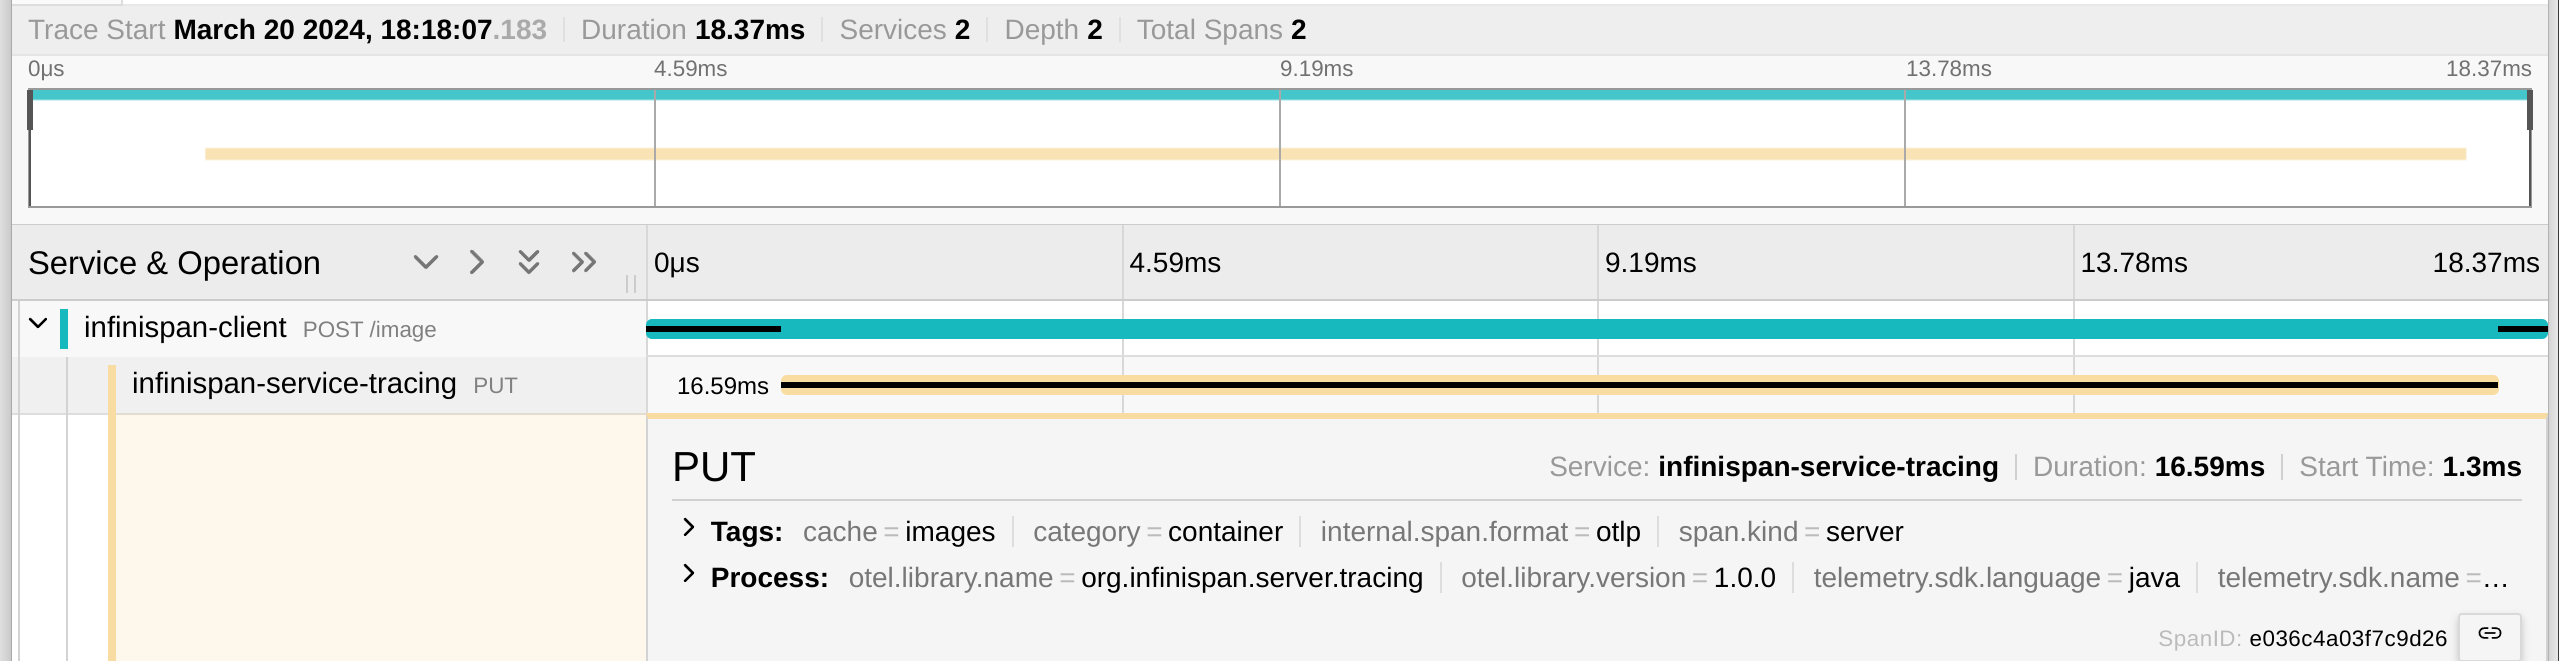
We have the client’s span and its matching container-level span on the server.
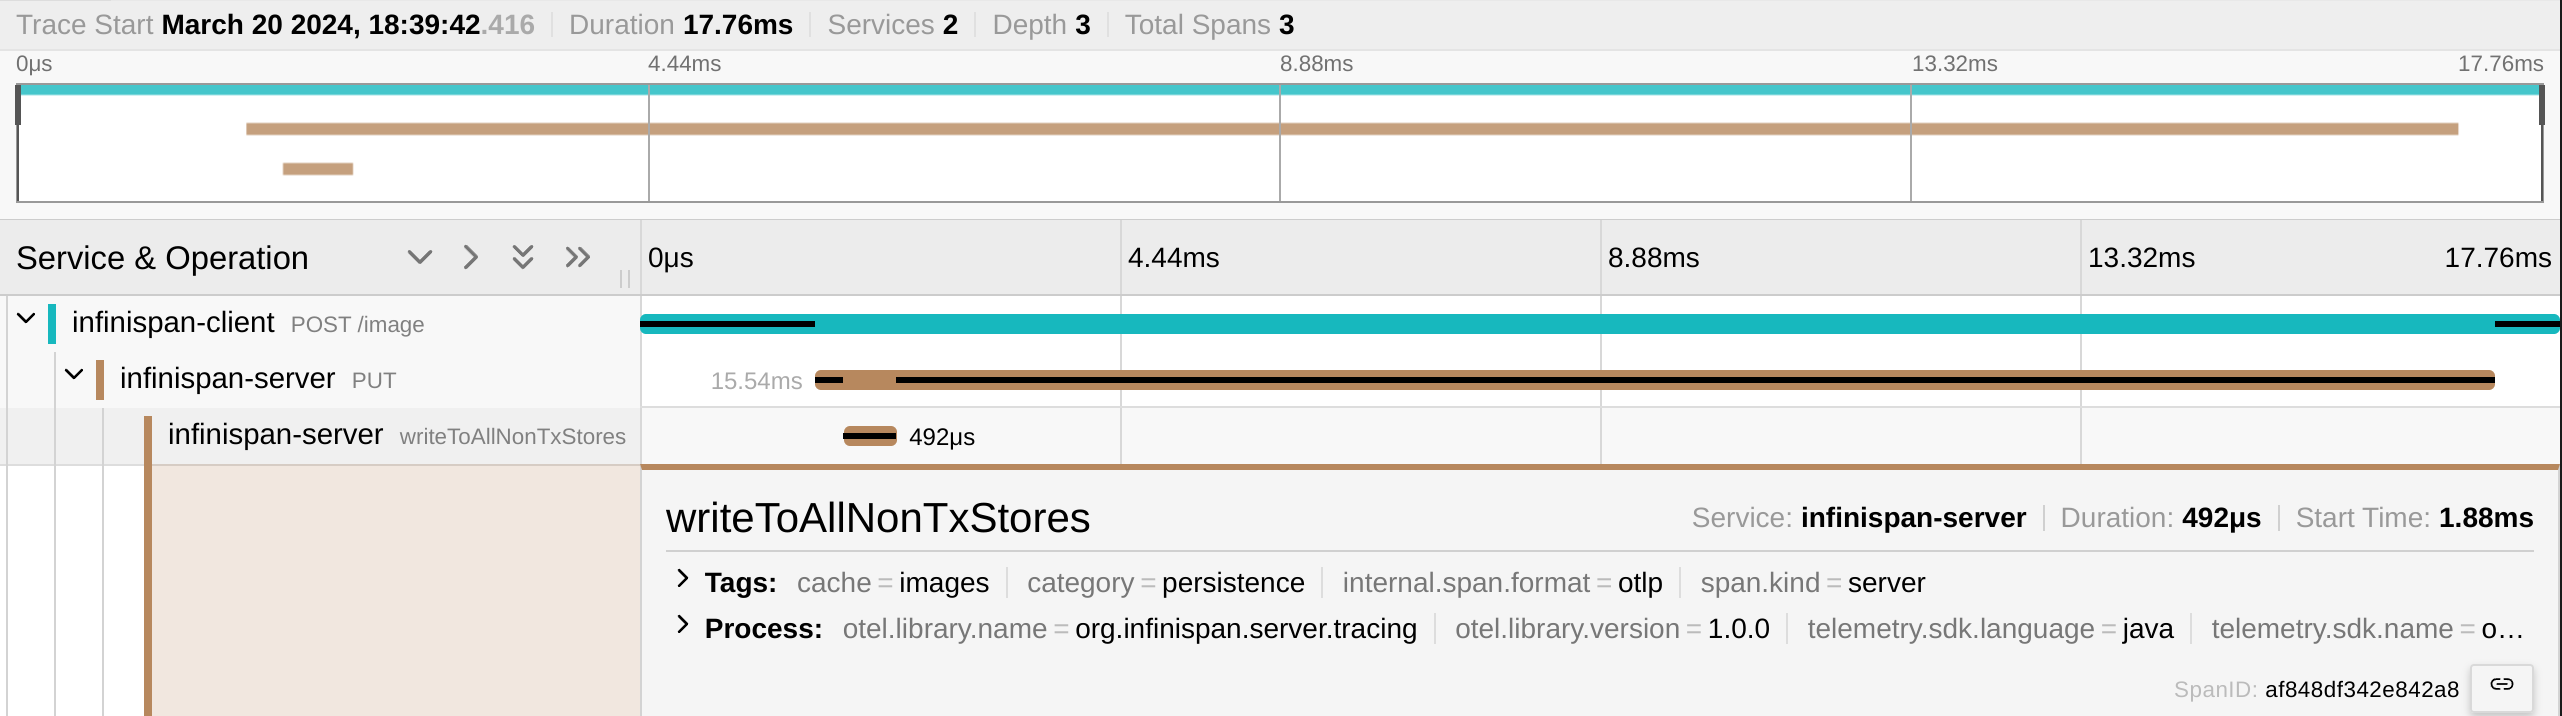
Enable more span categories to gain further insights into Infinispan’s internal operations.
In our demo we initially enable the persistence category at runtime. After some interactions from the client, we can observe the internal calls that Infinispan makes to interact with the configured cache store.
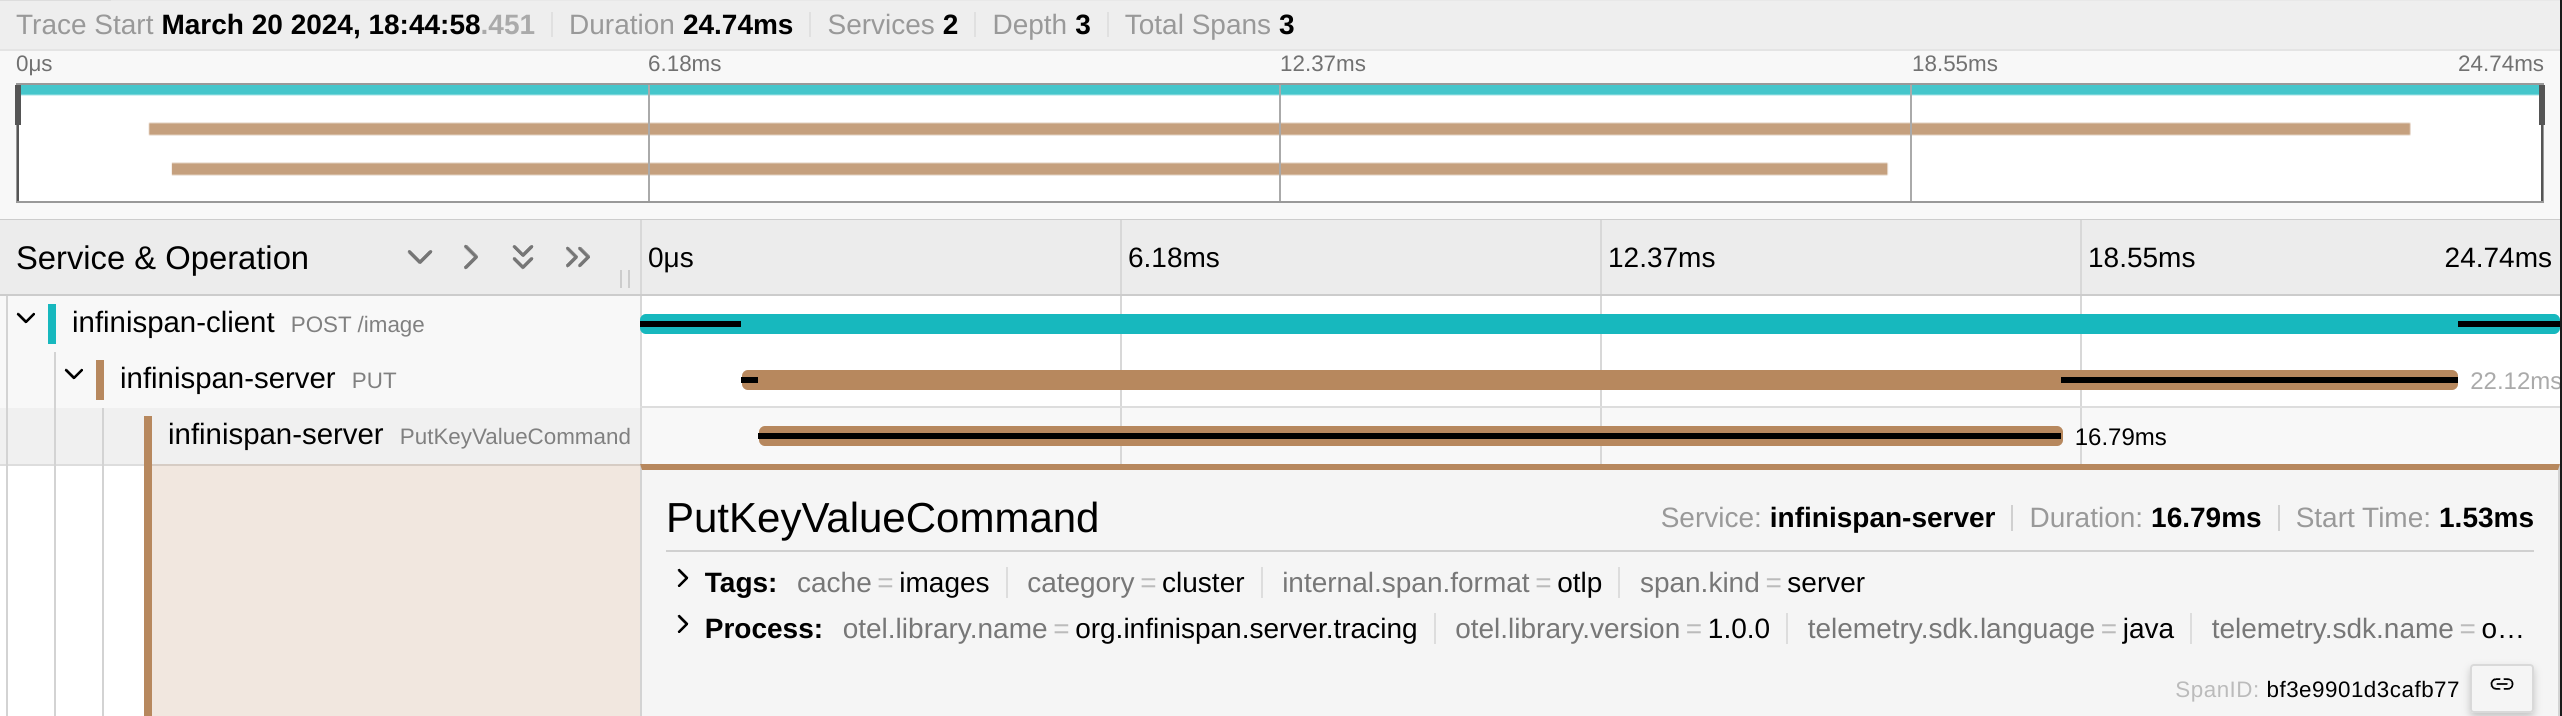
Afterwards, we enable (also at runtime) the cluster category. After the first interaction, it’s possible to observe the call that the Infinispan Server makes to synchronize the cluster alignment.
For more information, read the documentation guide: Enabling and configuring Infinispan OpenTelemetry tracing.
Get it, Use it, Ask us!
We’re hard at work on new features, improvements and fixes, so watch this space for more announcements!Please, download and test the latest release.
The source code is hosted on GitHub. If you need to report a bug or request a new feature, look for a similar one on our GitHub issues tracker. If you don’t find any, create a new issue.
If you have questions, are experiencing a bug or want advice on using Infinispan, you can use GitHub discussions. We will do our best to answer you as soon as we can.
The Infinispan community uses Zulip for real-time communications. Join us using either a web-browser or a dedicated application on the Infinispan chat.
Fabio Massimo Ercoli
Member of the Infinispan @core team. Accountable for indexing, query, serialization, transcoding, metrics and tracing for the hybrid cloud. Former Hibernate @core team, working on NoSql & searching. Former Red Hat consultant, working on intense data applications and solutions. An open source enthusiast and continuous learner.

