Thursday, 05 June 2014
Map/Reduce Performance improvements between Infinispan 6 and 7
Introduction
There have been a number of recent Infinispan 7.0 Map/Reduce performance related improvements that we were eager to test in our performance lab and subsequently share with you. The results are more than promising. In the word count use case, Map/Reduce task execution speed and throughput improvement is between fourfold and sixfold in certain situations that were tested.
We have achieved these improvements by focusing on:
-
Optimized mapper/reducer parallel execution on all nodes
-
Improving the handling and processing of larger data sets
-
Reducing the amount of memory needed for execution of MapReduceTask
Performance Test Results
The performance tests were run using the following parameters:
-
An Infinispan 7.0.0-SNAPSHOT build created after the last commits from the list were committed to the Infinispan GIT repo on May 9th vs Infinispan 6.0.1.Final
-
OpenJDK version 1.7.0_55 with 4GB of heap and the following JVM options:
-
Random data filled 30% of the Java heap, and 100 random words were used to create the 8 kilobyte cache values. The cache keys were generated using key affinity, so that the generated data would be distributed evenly in the cache. These values were chosen, so that a comparison to Infinispan 6 could be made. Infinispan 7 can handle a final result map with a much larger set of keys than is possible in Infinispan 6. The actual amount of heap size that is used for data will be larger due to backup copies, since the cluster is running in distributed mode.
-
The MapReduceTask executes a word count against the cache values using mapper, reducer, combiner, and collator implementations. The collator returns the 10 most frequently occurring words in the cache data. The task used a distributed reduce phase and a shared intermediate cache. The MapReduceTask is executed 10 times against the data in the cache and the values are reported as an average of these durations.
From 1 to 8 nodes using a fixed amount of data and 30% of the heap
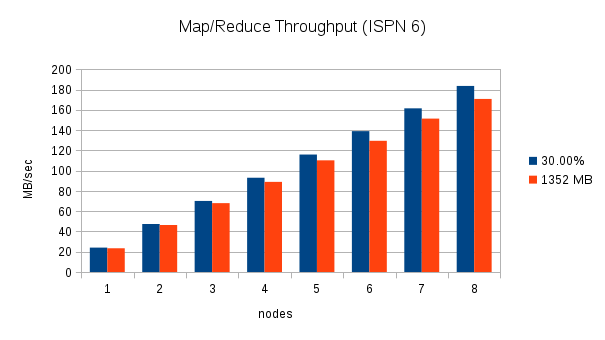
This test executes two word count executions on each cluster with an increasing number of nodes. The first execution uses an increasing amount of data equal to 30% of the total Java heap across the cluster (i.e. With one node, the data consumes 30% of 4 GB. With two nodes, the data consumes 30% of 8 GB, etc.), and the second execution uses a fixed amount of data, (1352 MB which is approximately 30% of 4 GB). Throughput is calculated by dividing the total amount of data processed by the Map/Reduce task by the duration. The following charts show the throughput as nodes are added to the cluster for these two scenarios:
These charts clearly show the increase in throughput that were made in Infinispan 7. The throughput also seems to scale in an almost linear fashion for this word count scenario. With one node, Infinispan 7 processes the 30% of heap data in about 100 MB/sec, two nodes process almost 200 MB/sec, and 8 nodes process over 700 MB/sec.
From 1 to 8 nodes using different heap size percentages
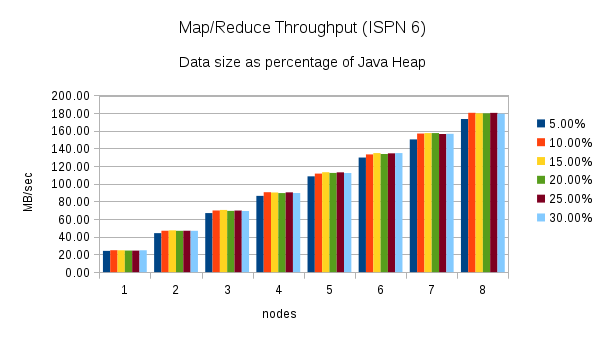
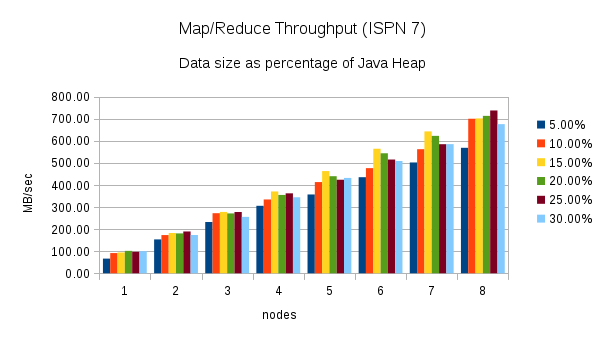
This test executes the word count task using different percentages of heap size as nodes are added to the cluster. (5%, 10%, 15%, 20%, 25%, and 30%) Here are the throughput results for this test:
 http://2.bp.blogspot.com/-fqmkYkxZtyI/U5AqS08Xk9I/AAAAAAAAACA/_wsTOmSbkdc/s1600/ISPN7_multi_ram_percent_throughput.png[
 ]
]
Once again, these charts show an increase in throughput when performing the same word count task using Infinispan 7. The chart for Infinispan 7 shows more fluctuation in the throughput across the different percentages of heap size. The throughput plotted in the Infinispan 6 chart is more consistent.
From 1 to 8 nodes using different value sizes
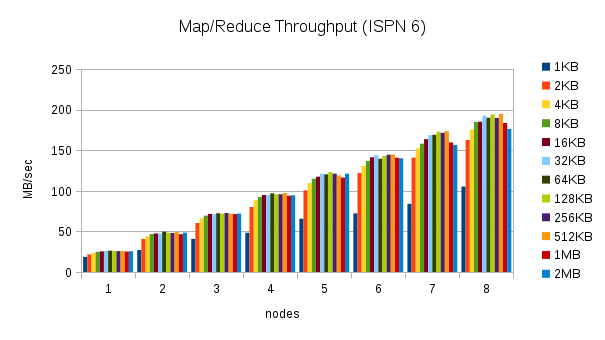
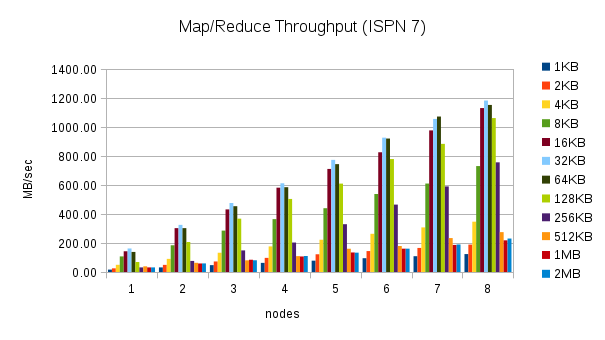
This test executes the word count task using 30% of the heap size and different cache value sizes as nodes are added to the cluster. (1KB, 2KB, 4KB, 8KB, 16KB, 32KB, 64KB, 128KB, 256KB, 512KB, 1MB, and 2MB) Here are the throughput results for this test:
These results are more interesting. The throughput in Infinispan 7 is higher for certain cache size values, but closer to Infinispan 6 or even slower for other cache size values. The throughput peaks for 32KB cache values, but can be much lower for larger and smaller values. Smaller values require more overhead, but for larger values this behavior is not expected. This result needs to be investigated more closely.
Conclusion
The performance tests show that Infinispan 7 Map/Reduce improvements have increased the throughput and execution speed four to sixfold in some use cases. The changes have also allowed Infinispan 7 to process data sets that include larger intermediate results and produce larger final result maps. There are still areas of the Map/Reduce algorithm that need to be improved:
-
The Map/Reduce algorithm should be self-tuning. The maxCollectorSize parameter controls the number of values that the collector holds in memory, and it is not trivial to determine the optimal value for a given scenario. The value is based on the size of the values in the cache and the size of the intermediate results. A user is likely to know the size of the cache values, but currently Infinispan does not report statistics about the intermediate results to the user. The Map/Reduce algorithm should analyze the environment at runtime and adjust the size of the collector dynamically.
-
The fact that the throughput results vary with different value sizes needs to be investigated more closely. This could be due to the fact that the maxCollectorSize value used for these tests is not ideal for all value sizes, but there might be other causes for this behaviour.
Tags: radargun benchmarks performance map reduce
Thursday, 22 December 2011
Startup performance
One of the things I’ve done recently was to benchmark how quickly Infinispan starts up. Specifically looking at LOCAL mode (where you don’t have the delays of opening sockets and discovery protocols you see in clustered mode), I wrote up a very simple test to start up 2000 caches in a loop, using the same cache manager.
This is a pretty valid use case, since when used as a non-clustered 2nd level cache in Hibernate, a separate cache instance is created per entity type, and in the past this has become somewhat of a bottleneck.
In this test, I compared Infinispan 5.0.1.Final, 5.1.0.CR1 and 5.1.0.CR2. 5.1.0 is significantly quicker, but I used this test (and subsequent profiling) to commit a couple of interesting changes in 5.1.0.CR2, which has improved things even more - both in terms of CPU performance as well as memory footprint.
Essentially, 5.1.0.CR1 made use of Jandex to perform annotation scanning of internal components at build-time, to prevent expensive reflection calls to determine component dependencies and lifecycle at runtime. 5.1.0.CR2 takes this concept a step further - now we don’t just cache annotation lookups at build-time, but entire dependency graphs. And determining and ordering of lifecycle methods are done at build-time too, again making startup times significantly quicker while offering a much tighter memory footprint.
Enough talk. Here is the test used, and here are the performance numbers, as per my laptop, a 2010 MacBook Pro with an i5 CPU.
Multiverse:InfinispanStartupBenchmark manik [master]$ ./bench.sh ---- Starting benchmark ---
Please standby …
Using Infinispan 5.0.1.FINAL (JMX enabled? false) Created 2000 caches in 10.9 seconds and consumed 172.32 Mb of memory.
Using Infinispan 5.0.1.FINAL (JMX enabled? true) Created 2000 caches in 56.18 seconds and consumed 315.21 Mb of memory.
Using Infinispan 5.1.0.CR1 (JMX enabled? false) Created 2000 caches in 7.13 seconds and consumed 157.5 Mb of memory.
Using Infinispan 5.1.0.CR1 (JMX enabled? true) Created 2000 caches in 34.9 seconds and consumed 243.33 Mb of memory.
Using Infinispan 5.1.0.CR2(JMX enabled? false) Created 2000 caches in 3.18 seconds and consumed 142.2 Mb of memory.
Using Infinispan 5.1.0.CR2(JMX enabled? true) Created 2000 caches in 17.62 seconds and consumed 176.13 Mb of memory.
A whopping 3.5 times faster, and significantly more memory-efficient especially when enabling JMX reporting. :-)
Enjoy! Manik
Tags: benchmarks cpu memory performance
Wednesday, 10 August 2011
Transactions enhancements in 5.0
Besides other cool features such as Map reduce and distributed executors, Infinispan 5.0.0 "Pagoa" brings some significant improvements around transactional functionality:
-
transaction recovery http://community.jboss.org/docs/DOC-16646?uniqueTitle=false is now supported, with a set of tools that allow state reconciliation in case the transaction fails during 2nd phase of 2PC. This is especially useful in the case of transactions spreading over Infinispan and another resource manager, e.g. a database (distributed transactions). You can find out more on how to enable and use transaction recovery here.
-
Synchronization enlistment is another important feature in this release. This allows Infinispan to enlist in a transaction as an Synchronization rather than an XAResource.This enlistment allows the TransactionManager to optimize 2PC with a 1PC where only one other resource is enlisted with that transaction (last resource commit optimization). This is particularly important when using Infinispan as a 2nd level cache in Hibernate. You can read more about this feature here.
-
besides that several bugs were fixed particularly when it comes to the integration with a transaction manager - BIG thanks to the community for reporting and testing them!
To summarise, Infinispan can participate in a transaction in 3 ways:
-
as a fully fledged XAResource that supports recovery
-
as an XAResource, but without recovery. This is the default configuration
-
and as an Synchronization
In order to analyze the performance of running Infinispan in different transactional modes I’ve enhanced and used Radargun. The diagram below shows a performance comparison between running Infinispan in all the 3 modes described. The forth plot in the chart shows the performance of running Infinispan without transactions - this gives an idea about the cost of using transactions vs. raw operations.
The benchmark was run on this Radargun configuration, using Infinispan 5.0.0.CR5 configured as shown here. As a TransactionManager JBossTS 4.15.0.FINAL was used, configured with a VolatileStore as shown here. Each node was an 4-core Intel® Xeon® CPU E5640 @ 2.67GHz, with 4GB RAM.
Each transaction spread over only one put operation. The chart shows the following:
-
a non-transactional put is about 40% faster than a transactional one
-
Synchronization-enlisted transactions outperform an XAResource enlisted one by about 20%
-
A recoverable cache has about the same performance as a non-recoverable cache when it comes to transactions.
And that’s not all! During Infinispan 5.0.0 development we’ve been thinking a lot about how we can improve transactional throughput, especially in scenarios in which multiple transactions are writing on the same key. As a result we’ve come up with some improvement suggestions summarised here: please feel free to take a look and comment!
Cheers,
Mircea
Tags: jta radargun transactions benchmarks
Friday, 17 December 2010
Announcing project Radargun
Hi all,
Radargun is a tool we’ve developed and used for benchmarking Infinispan’s performance both between releases and compared with other similar products. Initially we shipped under the (poorly named) Cache Benchmark Framework. Due to increase community interest and the fact that this reached a certain maturity (we used it for benchmarking 100+ nodes clusters) we decided to revamp it a little and also come with another name: Radargun. You can read more about it here. A good start is the 5MinutesTutorial.
Cheers, Mircea
Tags: radargun benchmarks cache benchmark framework
Tuesday, 23 February 2010
Infinispan 4.0.0.Final has landed!
 It is with great pleasure that I’d like to announce the availability of the final release of Infinispan 4.0.0. Infinispan is an open source, Java-based data grid platform that I first announced last April, and since then the codebase has been through a series of alpha and beta releases, and most recently 4 release candidates which generated a lot of community feedback.
It has been a long and wild ride, and the very active community has been critical to this release. A big thank you to everyone involved, you all know who you are.
Benchmarks
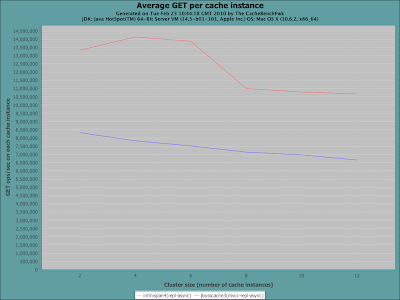
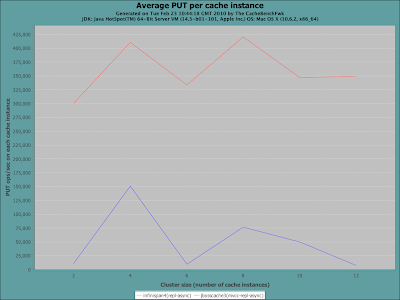
I recently published an article about running Infinispan in local mode - as a standalone cache - compared to JBoss Cache and EHCache. The article took readers through the ease of configuration and the simple API, and then demonstrated some performance benchmarks using the recently-announced Cache Benchmarking Framework. We’ve been making further use of this benchmarking framework in the recent weeks and months, extensively testing Infinispan on a large cluster.
Here are some simple charts, generated using the framework. The first set compare Infinispan against the latest and greatest JBoss Cache release (3.2.2.GA at this time), using both synchronous and asynchronous replication. But first, a little bit about the nodes in our test lab, comprising of a large number of nodes, each with the following configuration:
-
2 x Intel Xeon E5530 2.40 GHz quad core, hyperthreaded processors (= 16 hardware threads per node)
-
12GB memory per node, although the JVM heaps are limited at 2GB
-
RHEL 5.4 with Sun 64-bit JDK 1.6.0_18
-
InfiniBand connectivity between nodes
And a little bit about the way the benchmark framework was configured:
-
Run from 2 to 12 nodes in increments of 2
-
25 worker threads per node
-
Writing 1kb of state (randomly generated Strings) each time, with a 20% write percentage
| + | Reads | Writes |
|---|---|---|
Synchronous Replication | ||
Asynchronous Replication |
As you can see, Infinispan significantly outperforms JBoss Cache, even in replicated mode. The large gain in read performance, as well as asynchronous write performance, demonstrates the minimally locking data container and new marshalling techniques in Infinispan. But you also notice that with synchronous writes, performance starts to degrade as the cluster size increases. This is a characteristic of replicated caches, where you always have fast reads and all state available on each and every node, at the expense of ultimate scalability.
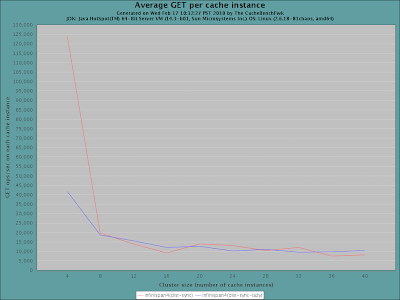
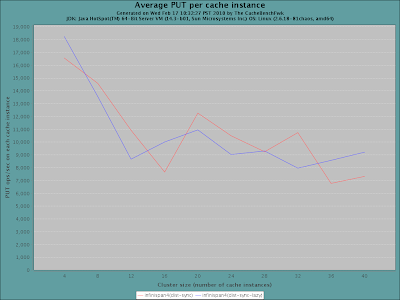
Enter Infinispan’s distributed mode. The goal of data distribution is to maintain enough copies of state in the cluster so it can be durable and fault tolerant, but not too many copies to prevent Infinispan from being scalable, with linear scalability being the ultimate prize. In the following runs, we benchmark Infinispan’s synchronous, distributed mode, comparing 2 different Infinispan configurations. The framework was configured with:
-
Run from 4 to 48 nodes, in increments of 4 (to better demonstrate linear scalability)
-
25 worker threads per node
-
Writing 1kb of state (randomly generated Strings) each time, with a 20% write percentage
| + | Reads | Writes |
|---|---|---|
Synchronous Distribution |
As you can see, Infinispan scales linearly as the node count increases. The different configurations tested, lazy stands for enabling lazy unmarshalling, which allows for state to be stored in Infinispan as byte arrays rather than deserialized objects. This has certain advantages for certain access patterns, for example where remote lookups are very common and local lookups are rare.
How does Infinispan comparing against ${POPULAR_PROPRIETARY_DATAGRID_PRODUCT}?
Due to licensing restrictions on publishing benchmarks of such products, we are unfortunately not at liberty to make such comparisons public - although we are very pleased with how Infinispan compares against popular commercial offerings, and plan to push the performance envelope even further in 4.1.
And just because we cannot publish such results, that does not mean that you cannot run such comparisons yourself. The Cache Benchmark Framework has support for different data grid products, including Oracle Coherence, and more can be added easily.
Aren’t statistics just lies? We strongly recommend you running the benchmarks yourself. Not only does this prove things for yourself, but also allows you to benchmark behaviour on your specific hardware infrastructure, using the specific configurations you’d use in real-life, and with your specific access patterns.
So where do I get it?
Infinispan is available on the Infinispan downloads page. Please use the user forums to communicate with us about the release. A full change log of features in this release is on JIRA, and documentation is on our newly re-organised wiki. We have put together several articles, chapters and examples; feel free to suggest new sections for this user guide - topics you may find interesting or bits you feel we’ve left out or not addressed as fully.
What’s next?
We’re busy hacking away on Infinispan 4.1 features. Expect an announcement soon on this, including an early alpha release for folks to try out. If you’re looking for Infinispan’s roadmap for the future, look here.
Cheers, and enjoy!
Manik
Tags: release benchmarks final
Tuesday, 02 February 2010
Infinispan as a LOCAL cache
While Infinispan has got the distributed, in-memory data grid market firmly it in its sight, there is also another aspect of Infinispan which I feel people would find interesting.
At its heart Infinispan is a highly concurrent, extremely performant data structure than can be distributed, or could be used in a standalone, local mode - as a cache. But why would people use Infinispan over, say, a ConcurrentHashMap? Here are some reasons.
Feature-rich
-
Eviction. Built-in eviction ensures you don’t run out of memory.
-
Write-through and write-behind caching. Going beyond memory and onto disk (or any other pluggable CacheStore) means that your state survives restarts, and preloaded hot caches can be configured.
-
JTA support and XA compliance. Participate in ongoing transactions with any JTA-compliant transaction manager.
-
MVCC-based concurrency. Highly optimized for fast, non-blocking readers.
-
Manageability. Simple JMX or rich GUI management console via JOPR, you have a choice.
-
Not just for the JVM. RESTful API, and upcoming client/server modules speaking Memcached and HotRod protocols help non-JVM platforms use Infinispan.
-
Cluster-ready. Should the need arise.
*Easy to configure, easy to use*
The simplest configuration file containing just
<infinispan />is enough to get you started, with sensible defaults abound. (More detailed documentation is also available).
All the features above are exposed via an easy-to-use Cache interface, which extends ConcurrentMap and is compatible with many other cache systems. Infinispan even ships with migration tools to help you move off other cache solutions onto Infinispan, whether you need a cache to store data retrieved remotely or simply as a 2nd level cache for Hibernate.
*Performance*
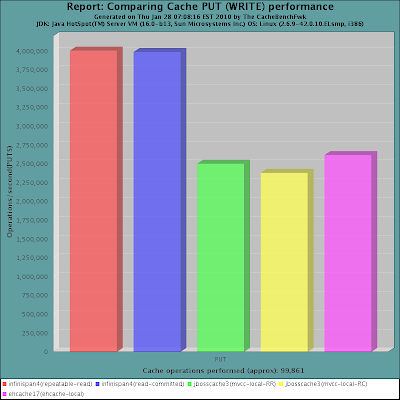
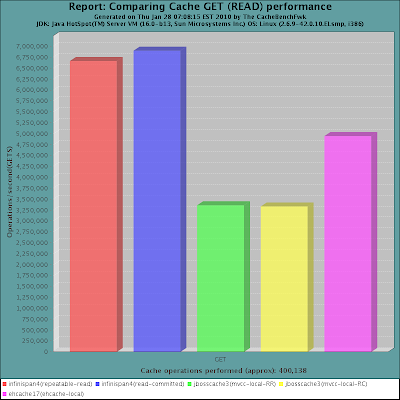
In the process of testing and tuning Infinispan on very large clusters, we have started to put together a benchmarking framework. As a part of this framework, we have the ability to measure cache performance in standalone, local mode. So in the context of this blog post, I’d
like to share some recent performance numbers of Infinispan - a recent snapshot - compared against the latest JBoss Cache release (3.2.2.GA) and EHCache (1.7.2). Some background on the tests:
-
Used a latest snapshot of the CacheBenchFwk
-
Run on a RHEL 5 server with 4 Intel Xeon cores, 4GB of RAM
-
Sun JDK 1.6.0_18, with -Xms1g -Xmx1g
-
Test run on a single node, with 25 concurrent threads, using randomly generated Strings as keys and values and a 1kb payload for each entry, with a 80/20 read/write ratio.
-
Performance measured in transactions per second (higher = better).
In summary, what we have here is that when run in local mode, Infinispan is a high-performance standalone caching engine which offers a rich set of features while still being trivially simple to configure and use.
Enjoy,
Manik
Tags: benchmarks jboss cache hibernate local mode second level cache provider ehcache
Monday, 27 July 2009
Increase transactional throughput with deadlock detection
Deadlock detection is a new feature in Infinispan. It is about increasing the number of transactions that can be concurrently processed. Let’s start with the problem first (the deadlock) then discuss some design details and performance.
So, the by-the-book deadlock example is the following:
-
Transaction one (T1) performs following operation sequence: (write key_1,write key_2)
-
Transaction two (T2) performs following sequence: (write key_2, write key_1).
Now, if the T1 and T2 happen at the same time and both have executed first operation, then they will wait for each other virtually forever to release owned locks on keys. In the real world, the waiting period is defined by a lock acquisition timeout (LAT) - which defaults to 10 seconds - that allows the system to overcome such scenarios and respond to the user one way (successful) or the other(failure): so after a period of LAT one (or both) transaction will rollback, allowing the other to continue working.
Deadlocks are bad for both system’s throughput and user experience. System throughput is affected because during the deadlock period (which might extend up to LAT) no other thread will be able to update neither key_1 nor key_2. Even worse, access to any other keys that were modified by T1 or T2 will be similarly restricted. User experience is altered by the fact that the call(s) will freeze for the entire deadlock period, and also there’s a chance that both T1 and T2 will rollback by timing out.
As a side note, in the previous example, if the code running the transactions would(and can) enforce any sort of ordering on the keys accessed within the transaction, then the deadlock would be avoided. E.g. if the application code would order the operation based on the lexicographic ordering of keys, both T1 and T2 would execute the following sequence: (write key_1,write key_2), and so no deadlock would result. This is a best practice and should be followed whenever possible. Enough with the theory! The way Infinispan performs deadlock detection is based on an algorithm designed by Jason Greene and Manik Surtani, which is detailed here. The basic idea is to split the LAT in smaller cycles, as it follows:
lock(int lockAcquisitionTimeout) {
while (currentTime < startTime + timeout) {
 if (acquire(smallTimeout)) break;
 testForDeadlock(globalTransaction, key);
}
}
What testForDeadlock(globalTransaction, key) does is check weather there is another transaction that satisfies both conditions:
-
holds a lock on key and
-
intends to lock on a key that is currently called by this transaction.
If such a transaction is found then this is a deadlock, and one of the running transactions will be interrupted: the decision of which transaction will interrupt is based on coin toss, a random number that is associated with each transaction. This will ensure that only one transaction will rollback, and the decision is deterministic: nodes and transactions do not need to communicate with each other to determine the outcome.
Deadlock detection in Infinispan works in two flavors: determining deadlocks on transactions that spread over several caches and deadlock detection in transactions running on a single(local) cache.
Let’s see some performance figures as well. A class for benchmarking performance of deadlock detection functionality was created and can be seen here. Test description (from javadoc):
We use a fixed size pool of keys (KEY_POOL_SIZE) on which each transaction operates. A number of threads (THREAD_COUNT) repeatedly starts transactions and tries to acquire locks on a random subset of this pool, by executing put operations on each key. If all locks were successfully acquired then the tx tries to commit: only if it succeeds this tx is counted as successful. The number of elements in this subset is the transaction size (TX_SIZE). The greater transaction size is, the higher chance for deadlock situation to occur. On each thread these transactions are being repeatedly executed (each time on a different, random key set) for a given time interval (BENCHMARK_DURATION). At the end, the number of successful transactions from each thread is cumulated, and this defines throughput (successful tx) per time unit (by default one minute).
Disclaimer: The following figures are for a scenario especially designed to force very high contention. This is not typical, and you shouldn’t expect to see this level of increase in performance for applications with lower contention (which most likely is the case). Please feel free tune the above benchmark class to fit the contention level of your application; sharing your experience would be very useful!
Following diagram shows the performance degradation resulting from running the deadlock detection code by itslef in a scenario where no contention/deadlocks are present. http://2.bp.blogspot.com/_ISQfVF8ALAQ/Sm2h_re8qKI/AAAAAAAABqA/bsNgEyCkcYw/s1600-h/DLD_replicated.JPG[
]
Some clues on when to enable deadlock detection. A high number of transaction rolling back due to org.infinispan.util.concurrent.TimeoutException is an indicator that this functionality might help. TimeoutException might be caused by other causes as well, but deadlocks will always result in this exception being thrown. Generally, when you have a high contention on a set of keys, deadlock detection may help. But the best way is not to guess the performance improvement but to benchmark and monitor it: you can have access to statistics (e.g. number of deadlocks detected) through JMX, as it is exposed via the DeadlockDetectingLockManager MBean.
Tags: transactions benchmarks deadlock detection concurrency
