Thursday, 06 July 2017
Reactive Big Data demo working with Infinispan 9.0.3.Final
A couple of months ago I did an extensive blog post on a reactive Big Data demo I did for Great Indian Developer Summit. At the time, the demo relied on a custom Infinispan build which fixed ISPN-7814 and ISPN-7710 issues.
These issues are now fixed in the main repository and the 9.0.x branch, and so you can now run the demo, as is, using Infinispan 9.0.3.Final. I’ve updated the demo so that it uses this version.
Cheers, Galder
Tags: conference demo
Friday, 05 May 2017
Reactive Big Data on OpenShift In-Memory Data Grids
Thanks a lot to everyone who attended the Infinispan sessions I gave in Great Indian Developer Summit! Your questions after the talks were really insightful.
One of the talks I gave was titled Big Data In Action with Infinispan (slides are available here), where I was looking at how Infinispan based in-memory data grids can help you deal with the problems of real-time big data and how to do big data analytics.
During the talk I live coded a demo showing both real-time and analytics parts, running on top of OpenShift and using Vert.x for joining the different parts. The demo repository contains background information on instructions to get started with the demo, but I thought it’d be useful to get focused step-by-step instructions in this blog post.
Set Up
Before we start with any of the demos, it’s necessary to run some set up steps:
1. Check out git repository:
2. Install OpenShift Origin or Minishift to get an OpenShift environment running in your own
machine. I decided to use OpenShift Origin, so the instructions below are tailored for that
environment, but similar instructions could be used with Minishift.
3. Install Anaconda for Python 3, this is required to run Jupyter notebook for plotting.
Demo Domain
Once the set up is complete, it’s time to talk about the demos before we run them.
Both demos shown below work with the same application domain: swiss rail transport systems. In this domain, we differentiate between physical stations, trains, station boards which are located in stations, and finally stops, which are individual entries in station boards.
Real Time Demo
The first demo is about working with real-time data from station boards around the country and presenting a centralised dashboard of delayed trains around the country. The following diagrams shows how the following components interact with each other to achieve this:
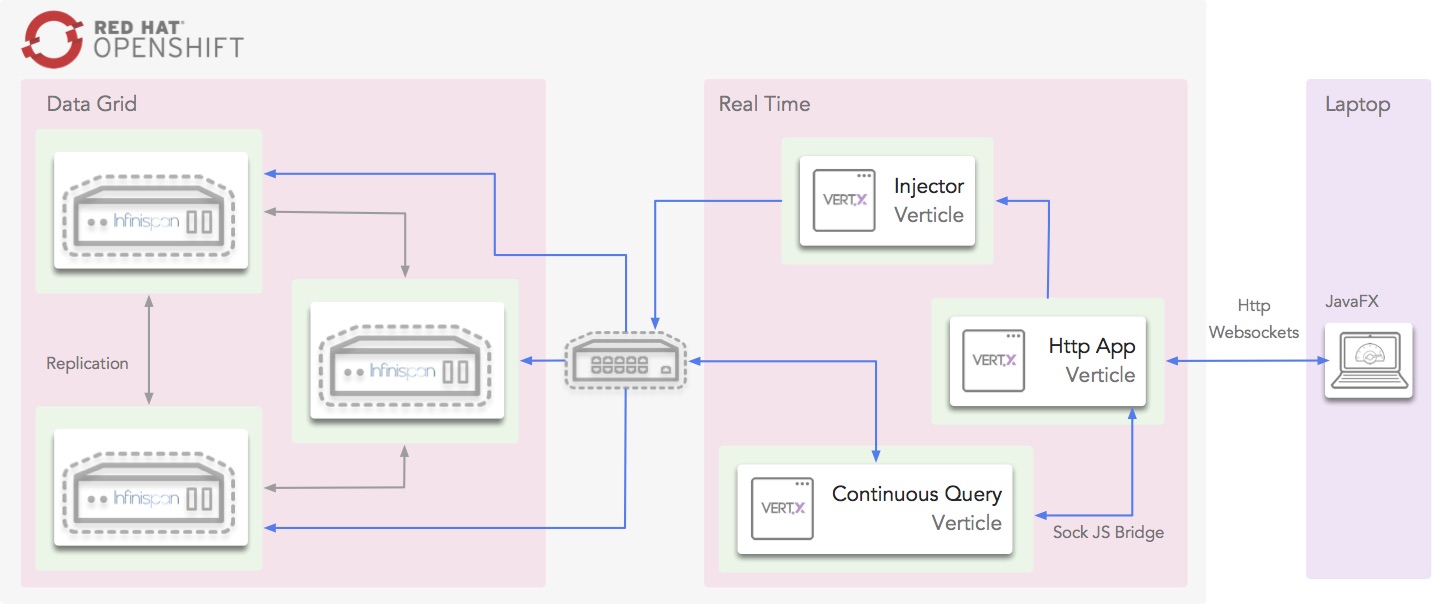
Infinispan, which provides the in-memory data grid storage, and Vert.x, which provides the glue for the centralised delayed dashboard to interact with Infinispan, all run within OpenShift cloud.
Within the cloud, the Injector verticle cycles through station board data and injects it into Infinispan. Also within the cloud, a Vert.x verticle that uses Infinispan’s Continuous Query to listen for station board entries that are delayed, and these are pushed into the Vert.x event bus, which in turn, via a SockJS bridge, get consumed via WebSockets from the dashboard. The centralised dashboards is written with JavaFX and runs outside the cloud.
To run the demo, do the following:
1. Start OpenShift Origin if you’ve not already done so:
oc cluster up --public-hostname=127.0.0.1
2. Deploy all the OpenShift cloud components:
cd ~/swiss-transport-datagrid
./deploy-all.sh
3. Open the OpenShift console and verify that all pods are up.
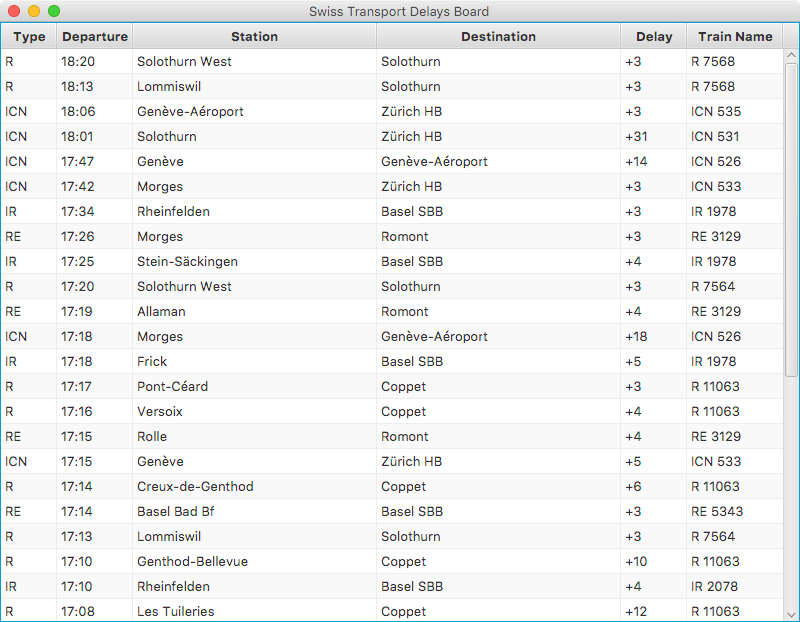
4. Load github repository into your favourite IDE and run
delays.query.continuous.fx.FxApp Java FX application. This will load the
centralised dashboard. Within seconds delayed trains will start appearing. For example:
Analytics Demo
The first demo is focused on how you can use Infinispan for doing offline analytics. In particular, this demo tries to answer the following question:
Q. What is the time of the day when there is the biggest ratio of delayed trains?
Once again, this demo runs on top of OpenShift cloud, uses Infinispan as in-memory data grid for storage and Vert.x for glueing components together.
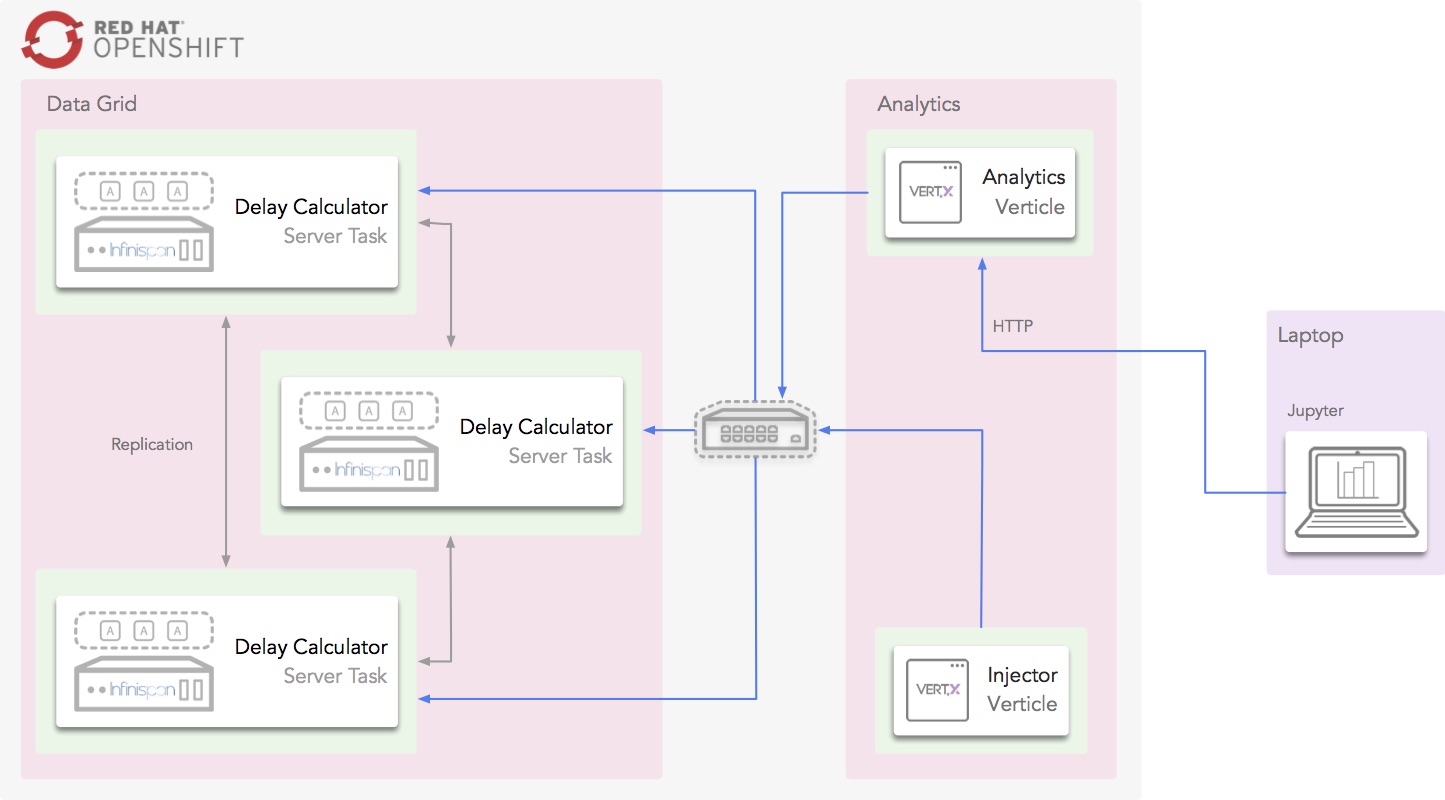
To answer this question, Infinispan data grid will be loaded with 3 weeks worth of data from station boards using a Vert.x verticle. Once the data is loaded, the Jupyter notebook will invoke an HTTP restful endpoint which will invoke an Vert.x verticle called AnalyticsVerticle.
This verticle will invoke a remote server task which will use Infinispan Distributed Java Streams to calculate the two pieces of information required to answer the question: per hour, how many trains are going through the system, and out of those, how many are delayed.
An important aspect to bear in mind about this server tasks is that it will only be executed in one of the nodes in the cluster. It does not matter which one. In turn, this node will will ship the lambdas required to do the computation to each of the nodes so that they can executed against their local data. The other nodes will reply with the results and the node where the server task was invoked will aggregate the results.
The results will be sent back to the originating invoker, the Jupyter notebook which will plot the results. The following diagrams shows how the following components interact with each other to achieve this:
Here is the demo step-by-step guide:
1. Start OpenShift Origin and deploy all components as shown in previous demo.
2. Start the Jupyter notebook:
cd ~/swiss-transport-datagrid/analytics/analytics-jupyter
~/anaconda/bin/jupyter notebook
3. Once the notebook opens, click open live-demo.ipynb notebook and execute each of the cells in order. You should end up seeing a plot like this:
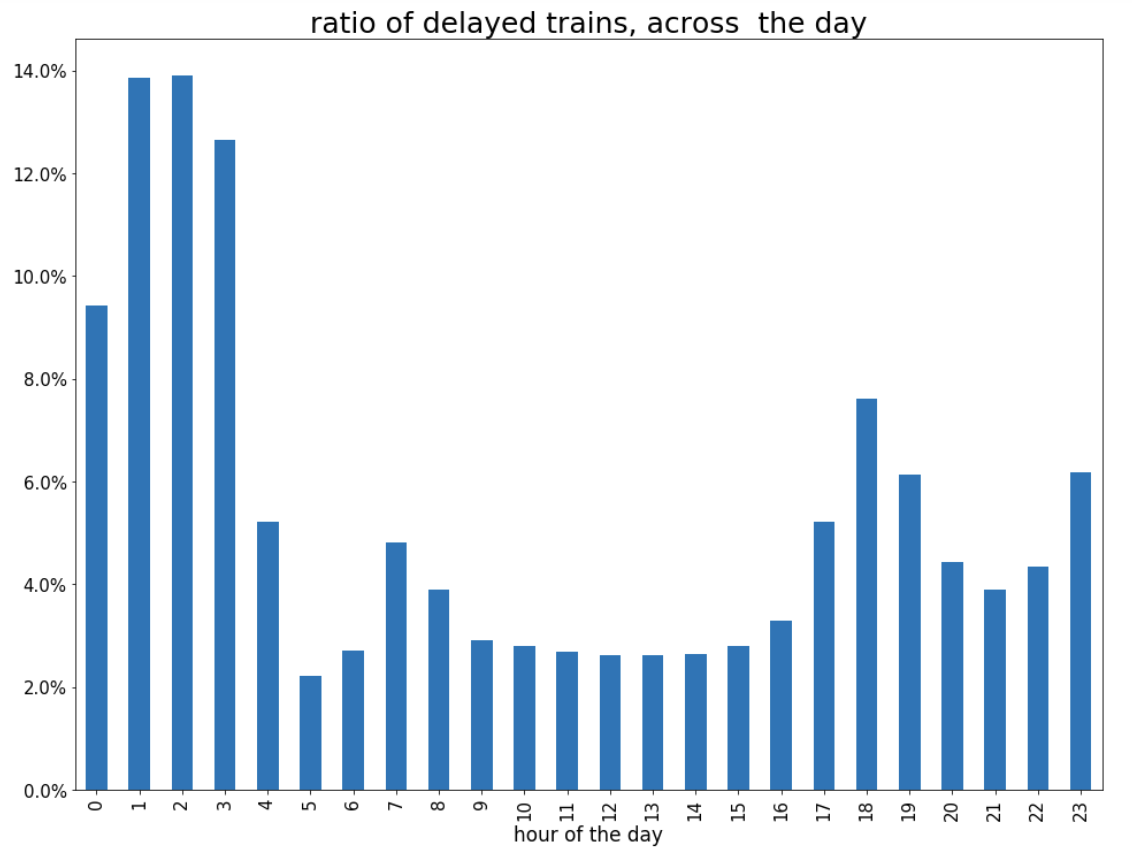
So, the answer to the question:
Q. What is the time of the day when there is the biggest ratio of delayed trains?
https://www.blogger.com/blogger.g?blogID=5717179571414330874https://www.blogger.com/blogger.g?blogID=5717179571414330874[]https://www.blogger.com/blogger.g?blogID=5717179571414330874
is 2am! That’s because last connecting trains of the day wait for each other to avoid leaving passengers stranded.
Conclusion
This has been a summary of the demos that I presented at Great Indian Developer Summit with the intention of getting you running these demos as quickly as possible. The repository contains more detailed information of these demos. If there’s anything unclear or any of the instructions above are not working, please let us know!
Once again, a very special thanks to Alexandre Masselot for being the inspiration for these demos. Merci @Alex!!
Over the next few months we will be enhancing the demo and hopefully we’ll be able to do some more live demonstrations at other conferences.
Cheers,
Galder
Tags: conference demo
Friday, 07 April 2017
In Memory Data Grid Patterns Demos from Devoxx France!
Devoxx France 2017 was a blast!! Emmanuel and I would like to thank all attendees to our in-memory data grids patterns talk. The room was full and we thoroughly enjoyed the experience!
During the talk we presented a couple of small demos that showcased some in-memory data grid use cases. The demos are located here, but I thought it’d be useful to provide some step-by-step here so that you can get them running as quickly as possible.
Before we start with any of the demos, it’s necessary to run some set up steps:
1. Check out git repository:
2. Download Infinispan Server 9.0.0.Final and at the same level as the git repository.
3. Go into the datagrid-patterns directory, start the servers and wait until they’ve started:
cd datagrid-patterns ./run-servers.sh
4. Install Anaconda for Python 3, this is required to run Jupyter notebook for plotting.
5. Install Maven 3.
Once the set up is complete, it’s time to start with the individual demos.
Both demos shown below work with the same application domain: rail transport systems. In this domain, we differentiate between physical stations, trains, station boards which are located in stations, and finally stops, which are individual entries in station boards.
Analytics Demo
The first demo is focused on how you can use Infinispan for doing offline analytics. In particular, this demo tries to answer the following question:
Q. What is the time of the day when there is the biggest ratio of delayed trains?
To answer this question, Infinispan data grid will be loaded with 3 weeks worth of data from station boards. Once the data is loaded, we will execute a remote server task which will use Infinispan Distributed Java Streams to calculate the two pieces of information required to answer the question: per hour, how many trains are going through the system, and out of those, how many are delayed.
An important aspect to bear in mind about this server tasks is that it will only be executed in one of the nodes in the cluster. It does not matter which one. In turn, this node will will ship the lambdas required to do the computation to each of the nodes so that they can executed against their local data. The other nodes will reply with the results and the node where the server task was invoked will aggregate the results.
Then, these results are sent back to the client, which in turn, stores the results as JSON in an intermediate cache. Once the results are in place, we will use a Jupyter notebook to read those results and plot the result.
Let’s see these steps in action:
1. First, we need to install the server tasks in the running servers above:
cd datagrid-patterns/analytics
mvn clean install package -am -pl analytics-server
mvn wildfly:deploy -pl analytics-server
2. Open the datagrid-pattern repo with your favourite IDE and run delays.java.stream.InjectApp class located in analytics/analytics-server project. This command will inject the data into the cache. On my environment, it takes between 1 and 2 minutes.
3. With the data loaded, we need to run the remote task that will calculate the total number of trains per hour and how many of those are delayed. To do that, execute delays.java.stream.AnalyticsApp class located in analytics/analytics-server project from your IDE.
4. You can verify that the results have been calculating by going to the following address:
5. With the results in place, it’s time to start the Jupyter notebook:
cd datagrid-patterns/analytics/analytics-jupyter
~/anaconda/bin/jupyter notebook
6. Once the notebook opens, click open live-demo.ipynb notebook and execute each of the cells in order. You should end up seeing a plot like this:

So, the answer to the question:
Q. What is the time of the day when there is the biggest ratio of delayed trains?
is 2am! That’s because last connecting trains of the day wait for each other to avoid leaving passengers stranded.
Real Time Demo
The second demo that we presented uses the same application domain as above, but this time we’re trying to use our data grid as a way of storing the station board state of each station at a given point in time. So, the idea is to use Infinispan as an in memory data grids for working with real time data.
So, what can we do with this type of data? In our demo, we will create a centralised dashboard of delayed trains around the country. To do that, we will take advantage of Infinispan’s Continuous Query functionality which allows us to find those station boards which contain stops that are delayed, and as new delayed trains appeared these will be pushed to our dashboard.
To run this demo, keep the same servers running as above and do the following:
-
Run delays.query.continuous.FxApp application located in real-time project inside the datagrid-patterns demo. This app will inject some live station board data and will launch a JavaFX dashboard that shows delayed trains as they appear. It should look something like this:

Conclusion
This has been a summary of the demos that we run in our talk at Devoxx France with the intention of getting you running these demos as quickly as possible. The repository contains more detailed information of these demos. If there’s anything unclear or any of the instructions above are not working, please let us know!
Thanks to Emmanuel Bernard for partnering with me for this Devoxx France talk and for the continuous feedback while developing the demos. Thanks as well to Tristan Tarrant for the input in the demos and many thanks to all Devoxx France attendees who attended our talk :)
A very special thanks to Alexandre Masselot whose "Swiss Transport in Real Time: Tribulations in the Big Data Stack" talk at Soft-Shake 2016 was the inspiration for these demos. @Alex, thanks a lot for sharing the demos and data with me and the rest of the community!!
In a just a few weeks I’ll be at Great Indian Developer Summit presenting these demos and much more! Stay tuned :)
Cheers,
Galder
Tags: conference devoxx demo streams query
Tuesday, 22 November 2011
Infinispan 5.1.0.BETA5 is out!
Infinispan 5.1.0.BETA5 has just been the released with a few interesting additions and important fixes:
-
Locks acquired within a transaction are now reordered in order to avoid deadlocks. There’s no new configuration required to take advantage of this feature. More information on how lock reordering works can be found here.
-
One of the aims of Infinispan 5.1 'Brahma' series is to move away from JAXB and instead use Stax based XML parsing. Ahead of that, a new configuration API based on builders has been developed. Expect to hear more about it and examples on using the API in the next few days.
Amongst the fixes included in this release, it’s worth mentioning:
-
The demo paths that were broken in 5.1.0.BETA4 have now been fixed.
-
Some of the Infinispan jars in 5.1.0.BETA4 were showing duplicate classes. This was the result of an OSGI bundle generation bug, and so to avoid the issue 5.1.0.BETA5 OSGI bundle generation has been disabled. This functionality will be re-enabled once the issue has been fixed by the Maven Felix plugin.
As always, please keep the feedback coming. You can download the release from here and you get further details on the issues addressed in the changelog.
Cheers,
Galder
Tags: locking configuration demo
Thursday, 09 June 2011
Keynote of the decade: behind the scenes, an Infinispan perspective
JBoss World 2011's much talked about keynote ended with a big bang - a live demo that many thought we were insane to even try and pull off - and has sparked off a lot of interest, many claiming JBoss has got its mojo back. One of the things people keep asking is, what actually went on? How did we build such a demo? How can we do the same?
 Firstly, if you did not attend the keynote or did not watch it online, I recommend that you stop reading this now, and go and watch the keynote. A recording is available online (the demo starts at about minute 35).
Ok, now that you’ve been primed, lets talk about the role Infinispan played in that demo. The demo involved reading mass volumes of real-time data off a Twitter stream, and storing these tweets in an Infinispan grid. This primary grid (known as Grid-A), and ran off 3 large rack-mount servers. The Infinispan nodes were standalone, bootstrapped off a simple Main class, and formed a cluster, running in asynchronous distributed mode with 2 data owners.
Andrew Sacamano did an excellent job of building an HTML 5-based webapp to visualise what goes on in such a grid, making use of cache listeners pushing events to browsers and browsers rendering the "spinning spheres" using HTML 5’s canvas tag. So now we could visualise data and data movement within a grid of Infinispan nodes.
 As Twitter data started to populate the grid, we fired up a second grid (Grid-B) consisting of 8 nodes. Again, these nodes were configured using asynchronous distribution and 2 data owners, but this time these nodes were running on very small and cheap plugtop computers. These plugtops - GuruPlugs - are constrained devices with 512MB of RAM, a 1GHz ARM processor.
Yes, your iPhone has more grunt :-) And yes, these sub-iPhone devices were running a real data grid!
The purpose of this was to demonstrate the extremely low footprint and overhead Infinispan imposes on your hardware (we even had to run the zero assembly port of OpenJDK, an interpreted-mode JVM, since the processor only had a 16-bit bus!). We also had a server running JBossAS running Andrew’s cool visualisation webapp rendering the contents of Grid-B, so people could "see" the data in both grids.
We then fired up Drools to have it mine the contents of Grid-A and send it to Grid-B applying some rules to select the interesting tweets, namely the ones having the hashtag #JBW. With this in place, we then invited the audience to participate - by tweeting with hashtag #JBW, as well as the hashtag of your favourite JBoss project - e.g., #infinispan :-) People were allowed to vote for more than one project, and the most prolific tweeter was to win a prize. This started a frenzy of tweeting, and was reflected in the two grid visualisations.
Not only Infinispan is very quick here: needless to say, Drools was sending the tweets from Grid-A to Grid-B using HornetQ, the fastest JMS implementation on the planet.
Jay Balunas of Richfaces built a TwitterStream app with live updates of these tweets for various devices, including iPhones, iPads, Android phones and tablets, and of course, desktop web browsers, grabbing data off Grid-B. Christian Sadilek and Mike Brock from the Errai team also built a tag-cloud application visualising popular tags as a tag cloud, again off Grid-B, making use of Errai to push events to the browser.
After simulating Mark Proctor to try cheating the system with a script, we could recover the correct votes: clear Grid-B, update the Drools rules to have it discard the cheat tweets, and have a cleaned up stream of tweets flow to Grid-B.
All applications, including Drools and the visualizations, where using a JPA interface to store or load the tweets: it was powered by an early preview of HibernateOGM, which aims to abstract any NoSQL store as a JPA persistence store while still providing some level of consistency. As HibernateOGM is not feature complete, it was using Hibernate Search to provide query capabilities via a Lucene index, and using the Infinispan integration of Hibernate Search to distribute the index on Infinispan.
We then demonstrated failover, as we invited the winner to come up on stage to choose and brutally un-plug one of the plugtops of his choice from Grid-B - this plugtop became his prize. Important to note, the webapps running off the grid did not risk to lose any data, Drools pulling stuff off Grid-A onto Grid-B was still able to continue running, the Lucene index could continually be updated and queried by the remaining nodes.
From an Infinispan perspective, what did this demo make use of?
-
Data distribution, numOwners = 2
-
Async network communication via JGroups
-
JTA integration with JBossTS
-
Cache listeners to notify applications of changes in data and topology
-
The Infinispan Lucene Directory distributing the Lucene index on the grid
So a fairly simple setup, using simple embeddable components, cheap hardware, to build a fairly complex application with excellent failover and scalability properties.
So we where depending on wi-fi connectivity, internet access, a live tweet stream, technology previews and people’s cooperation!
To make things more interesting, the day before the demo one of the servers died; hardware failure: didn’t survive the trip. A second server, meant to serve the UI webapps, started reporting failures on all network interfaces just before starting the demo: it could not figure out hardware addresses of cluster peers, and we had no time to replace him: its backup was already dead. Interesting enough we could tap in some advanced parameters of the JGroups configuration to workaround this issue.
Nothing was pre-recorded! Actually the backup plan was to have Mark Little dancing a tip-tap; next year we will try to stretch our demo even more so you might see that dance!
So here you can see the recording of the event: http://www.jboss.org/jbw2011keynote or listen to the behind the scenes podcast.
After the demo, we did hear of a large commercial application using Infinispan and Drools in precisely this manner - except instead of Twitter, the large data stream was flight seat pricing, changing dynamically and constantly, and eventually rendered to web pages of various travel sites - oh, and they weren’t running on plugtops in case you were thinking ;) So, the example isn’t completely artificial.
How do you use Infinispan? We’d love for you to share stories with us.
Cheers
Manik and Sanne
Tags: jbossworld demo
Tuesday, 25 May 2010
Infinispan EC2 Demo
Infinispan’s distributed mode is well suited to handling large datasets and scaling the clustered cache by adding nodes as required. These days when inexpensive scaling is thought of, cloud computing immediately comes to mind.
One of the largest providers of cloud computing is Amazon with its Amazon Web Services (AWS) offering. AWS provides computing capacity on demand with its EC2 services and storage on demand with its S3 and EBS offerings. EC2 provides just an operating system to run on and it is a relatively straightforward process to get an Infinispan cluster running on EC2. However there is one gotcha, EC2 does not support UDP multicasting at this time and this is the default node discovery approach used by Infinispan to detect nodes running in a cluster.
Some background on network communications
Infinispan uses the JGroups library to handle all network communications. JGroups enables cluster node detection, a process called discovery, and reliable data transfer between nodes. JGroups also handles the process of nodes entering and exiting the cluster and master node determination for the cluster.
Configuring JGroups in Infinispan The JGroups configuration details are passed to Infinispan in the infinispan configuration file
<transport clusterName="infinispan-cluster" distributedSyncTimeout="50000"
        transportClass="org.infinispan.remoting.transport.jgroups.JGroupsTransport">
    <properties>
       <property name="configurationFile" value="jgroups-s3_ping-aws.xml" />
    </properties>
 </transport>
Node Discovery
JGroups has three discovery options which can be used for node discovery on EC2.
The first is to statically configure the address of each node in the cluster in each of the nodes peers. This simplifies discovery but is not suitable when the IP addresses of each node is dynamic or nodes are added and removed on demand.
The second method is to use a Gossip Router. This is an external Java process which runs and waits for connections from potential cluster nodes. Each node in the cluster needs to be configured with the ip address and port that the Gossip Router is listening on. At node initialization, the node connects to the gossip router and retrieves the list of other nodes in the cluster.
Example JGroups gossip router configuration
<config>
   <TCP bind_port="7800" />
   <TCPGOSSIP timeout="3000" initial_hosts="192.168.1.20[12000]"
                  num_initial_members="3" />
   <MERGE2 max_interval="30000" min_interval="10000" />
   <FD_SOCK start_port="9777" />
   ...
</config>
The infinispan-4.1.0-SNAPSHOT/etc/config-samples/ directory has sample configuration files for use with the Gossip Router. The approach works well but the dependency on an external process can be limiting.
The third method is to use the new S3_PING protocol that has been added to JGroups. Using this the user configures a S3 bucket (location) where each node in the cluster will store its connection details and upon startup each node will see the other nodes in the cluster. This avoids having to have a separate process for node discovery and gets around the static configuration of nodes.
Example JGroups configuration using the S3_PING protocol:
<config>
    <TCP bind_port="7800" />
    <S3_PING secret_access_key="secretaccess_key" access_key="access_key"
                location=s3_bucket_location" />
    <MERGE2 max_interval="30000" min_interval="10000" />
    <FD_SOCK start_port="9777" />
    ...
</config>
EC2 demo
The purpose of this demo is to show how an Infinispan cache running on EC2 can easily form a cluster and retrieve data seamlessly across the nodes in the cluster. The addition of any subsequent Infinispan nodes to the cluster automatically distribute the existing data and offer higher availability in the case of node failure.
To demonstrate Infinispan, data is required to be added to nodes in the cluster. We will use one of the many public datasets that Amazon host on AWS, the influenza virus dataset publicly made available by Amazon.
This dataset has a number components which make it suitable for the demo. First of all it is not a trivial dataset, there are over 200,000 records. Secondly there are internal relationships within the data which can be used to demonstrate retrieving data from different cache nodes. The data is made up for viruses, nucleotides and proteins, each influenza virus has a related nucleotide and each nucleotide has one or more proteins. Each are stored in their own cache instance.
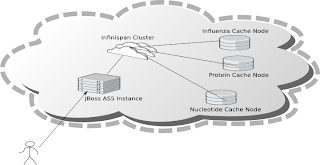
The caches are populated as follows :
-
InfluenzaCache - populated with data read from the
Influenza.datfile, approx 82,000 entries -
ProteinCache - populated with data read from the
Influenza_aa.datfile, approx 102,000 entries -
NucleotideCache - populated with data read from the
Influenza_na.datfile, approx 82,000 entries
The demo requires 4 small EC2 instances running Linux, one instance for each cache node and one for the Jboss application server which runs the UI. Each node has to have Sun JDK 1.6 installed in order to run the demos. In order to use the Web-based GUI, JBoss AS 5 should also be installed on one node.
In order for the nodes to communicate with each other the EC2 firewall needs to be modified. Each node should have the following ports open:
-
TCP 22 – For SSH access
-
TCP 7800 to TCP 7810 – used for JGroups cluster communications
-
TCP 8080 – Only required for the node running the AS5 instance in order to access the Web UI.
-
TCP 9777 - Required for FD_SOCK, the socket based failure detection module of the JGroups stack.
To run the demo, download the Infinispan "all" distribution, (infinispan-xxx-all.zip) to a directory on each node and unzip the archive.
Edit the etc/config-samples/ec2-demo/jgroups-s3_ping-aws.xml file to add the correct AWS S3 security credentials and bucket name.
Start the one of the cache instances on each node using one of the following scripts from the bin directory:
-
runEC2Demo-influenza.sh -
runEC2Demo-nucleotide.sh -
runEC2Demo-protein.sh
Each script will startup and display the following information :
[tmp\] ./runEC2Demo-nucleotide.shCacheBuilder called with /opt/infinispan-4.1.0-SNAPSHOT/etc/config-samples/ec2-demo/infinispan-ec2-config.xml
-------------------------------------------------------------------
GMS: address=redlappie-37477, cluster=infinispan-cluster, physical address=192.168.122.1:7800
-------------------------------------------------------------------
Caches created....
Starting CacheManagerCache
Address=redlappie-57930Cache
Address=redlappie-37477Cache
Address=redlappie-18122
Parsing files....Parsing [/opt/infinispan-4.1.0-SNAPSHOT/etc/Amazon-TestData/influenza_na.dat]
About to load 81904 nucleotide elements into NucleiodCache
Added 5000 Nucleotide records
Added 10000 Nucleotide records
Added 15000 Nucleotide records
Added 20000 Nucleotide records
Added 25000 Nucleotide records
Added 30000 Nucleotide records
Added 35000 Nucleotide records
Added 40000 Nucleotide records
Added 45000 Nucleotide records
Added 50000 Nucleotide records
Added 55000 Nucleotide records
Added 60000 Nucleotide records
Added 65000 Nucleotide records
Added 70000 Nucleotide records
Added 75000 Nucleotide records
Added 80000 Nucleotide records
Loaded 81904 nucleotide elements into NucleotidCache
Parsing files....Done
Protein/Influenza/Nucleotide Cache Size-->9572/10000/81904
Protein/Influenza/Nucleotide Cache Size-->9572/20000/81904
Protein/Influenza/Nucleotide Cache Size-->9572/81904/81904
Protein/Influenza/Nucleotide Cache Size-->9572/81904/81904
Items of interest in the output are the Cache Address lines which display the address of the nodes in the cluster. Also of note is the Protein/Influenza/Nucleotide line which displays the number of entries in each cache. As other caches are starting up these numbers will change as cache entries are dynamically moved around through out the Infinispan cluster.
To use the web based UI we first of all need to let the server know where the Infinispan configuration files are kept. To do this edit the jboss-5.1.0.GA/bin/run.conf file and add the line
JAVA_OPTS="$JAVA_OPTS -DCFGPath=/opt/infinispan-4.1.0-SNAPSHOT/etc/config-samples/ec2-demo/"at the bottom. Replace the path as appropriate.
Now start the Jboss application server using the default profile e.g. run.sh -c default -b xxx.xxx.xxx.xxx, where “xxx.xxx.xxx.xxx” is the public IP address of the node that the AS is running on.
Then drop the infinispan-ec2-demoui.war into the jboss-5.1.0.GA /server/default/deploy directory.
Finally point your web browser to http://public-ip-address:8080/infinispan-ec2-demoui and the following page will appear.

The search criteria is the values in the first column of the /etc/Amazon-TestData/influenza.dat file e.g. AB000604, AB000612, etc.

Note that this demo will be available in Infinispan 4.1.0.BETA2 onwards. If you are impatient, you can always build it yourself from Infinispan’s source code repository.
Enjoy, Noel
Tags: ec2 amazon jgroups s3 demo aws
Friday, 18 December 2009
New video demo: Monitoring Infinispan with Jopr console
Over the past few weeks, I’ve been working on improving how Infinispan is managed and/or monitored and I can finally share some of the results of that effort with you.
In the coming weeks, I’ll be sharing some in-depth flash movies explaining everything from installing Jopr, our enterprise management solution for JBoss middleware, to installing the Infinispan Jopr plugin, discovering Infinispan instances automatically or manually…etc
However, before that, I’d like to share a video demo with you where I briefly show a three-node Infinispan cluster being monitored. It demonstrates graphical measurements, and non-graphical information of running Infinispan instances, addition or removal of monitored metrics and finally, execution of management operations on a Infinispan instance.
The Infinispan version used in the video was a snapshot of Infinispan 4.0.0, but you should be able to replicate what’s shown in the video with Infinispan 4.0.0.CR3 or higher.
Enjoy :)
Tags: monitoring demo video jopr