Tuesday, 14 November 2017
Merci Duchess et Devoxx!
We’ve had two very hectic weeks delivering the Infinispan/http://vertx.io/[Vert.x]/https://www.openshift.com/[OpenShift] Streaming Data workshop in Duchess France and Devoxx Belgium. First of all, thanks to all attendees for taking the time to attend this workshop and working through it, thanks Duchess and Devoxx for letting us present the workshop, and thanks the sponsors for making it happen!
In case you want to walk through the workshop at your own pace, the version of the workshop delivered at Duchess and Devoxx can be found here. The slides from the workshop can be found here.
The aim of the workshop was to show how to work with multiple data streams and combine them in interested ways. These two streams of data came from Transport API at OpenData.ch and SBB.ch respectively. The end-game of the workshop was to see to combine both sets of information to produce a map that tracked positions of delayed trains around Switzerland.
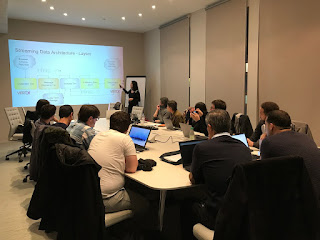
On 2nd November we did a dry run of the workshop in the Duchess France group. This was a very compact group of people, around 10-12, which gave us thve first taste of what it was like to work through it. In particular, we realised that getting Virtual Box to run on each attendees laptop took some time to get working. From the workshop perspective, we found that the exercises themselves were a bit too long for the people to complete.
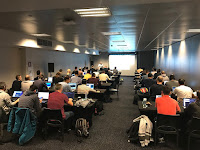
With all the invaluable input, Katia, Thomas and myself got ready for delivering the workshop at Devoxx Belgium, one of the top developer conferences in Europe. The pressure was on! We had ~60 attendees, so we had to make sure everyone could progress.
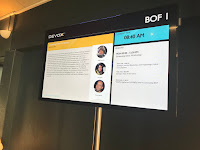 http://3.bp.blogspot.com/-KLl6Z6DKNbo/WgvgAamkJcI/AAAAAAAAFCM/V_Y8zC3e9aEcKMYi2nVYy7PBJ2I18lYvQCK4BGAYYCw/s1600/DN8JSiIXcAENChj.jpeg[
 ]
]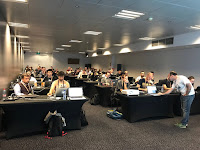
At Devoxx, we were more prepared to help out with set up problems, so everyone got to the starting point much faster. After working through the initial exercise to get used to Infinispan, Vert.x and OpenShift, attendees got on with the workshop itself.
During the workshop exercises, the learnt about Infinispan’s in-memory data grid capabilities, and in particular about continuous query which is very well suited for feeding data to live updating maps or dashboards. They also learnt about how easy it is to build reactive applications with Vert.x and RxJava. Finally, they learnt how to deploy applications to OpenShift, how to monitor their progress…etc.
A majority of Devoxx attendees managed to get to the end of the workshop which was a success for us, but we listen to their feedback and we will continue to improve the content and delivery as we prepare for Codemotion Madrid where we are delivering the workshop once again.
Thanks attendees, Devoxx, Duchess and sponsors!!
Cheers, Galder
Tags: conference workshop
Tuesday, 31 October 2017
Infinispan coming to Duchess France and Devoxx Belgium !
 https://3.bp.blogspot.com/-xri0FDt83PU/WfdRwBwuj8I/AAAAAAAACBc/z7IWyQ6gM2E_9gHPERUlx934_6E7_bYGQCLcBGAs/s1600/logo_duchess_all_in_one_small_rect.png[
 ]
]
This week, 2nd November, Galder and I will be presenting at Duchess France Meetup in Paris our "Streaming Data Workshop" : a 3h hours hands on lab that showcases a slightly simplified streaming architecture built on top of Infinispan and Vert.x and running on OpenShift.
If you are in Paris, the Duchess France workshop is actually full; if you are planning to assist Devoxx Belgium this year, the workshop will take place the 6th of November there.
Cheers, Katia
Tags: conference
Monday, 23 October 2017
Thanks Basel One 2017!
Thanks a lot to all attendees at Basel One 2017, it was great fun presenting about Infinispan, OpenShift and Vert.x topics just around the corner from my house :)
The slides for my talk can be found here. The code and scripts demo that I showed can be found here. I’ve also uploaded step-by-step instructions for the live-coding done during the talk.
Cheers, Galder
Tags: conference
Friday, 15 September 2017
DevNation Live video and slides available now!
Tags: conference video
Wednesday, 06 September 2017
Join us online on 7th September for DevNation talk on Infinispan!
Tomorrow, 7th of September at 12:00pm EDT, I will be doing an online live tech talk for Red Hat DevNation on showing how to handle big data with Infinispan.
If you didn’t manage to attend my talk at Great Indian Developer Summit or Berlin Buzzwords, this is your chance to see it live and direct, with live coding demos included!
You can register to see the talk live visiting the Red Hat DevNation Live site.
Cheers, Galder
Tags: conference devnation
Thursday, 06 July 2017
Reactive Big Data demo working with Infinispan 9.0.3.Final
A couple of months ago I did an extensive blog post on a reactive Big Data demo I did for Great Indian Developer Summit. At the time, the demo relied on a custom Infinispan build which fixed ISPN-7814 and ISPN-7710 issues.
These issues are now fixed in the main repository and the 9.0.x branch, and so you can now run the demo, as is, using Infinispan 9.0.3.Final. I’ve updated the demo so that it uses this version.
Cheers, Galder
Tags: conference demo
Friday, 05 May 2017
Reactive Big Data on OpenShift In-Memory Data Grids
Thanks a lot to everyone who attended the Infinispan sessions I gave in Great Indian Developer Summit! Your questions after the talks were really insightful.
One of the talks I gave was titled Big Data In Action with Infinispan (slides are available here), where I was looking at how Infinispan based in-memory data grids can help you deal with the problems of real-time big data and how to do big data analytics.
During the talk I live coded a demo showing both real-time and analytics parts, running on top of OpenShift and using Vert.x for joining the different parts. The demo repository contains background information on instructions to get started with the demo, but I thought it’d be useful to get focused step-by-step instructions in this blog post.
Set Up
Before we start with any of the demos, it’s necessary to run some set up steps:
1. Check out git repository:
2. Install OpenShift Origin or Minishift to get an OpenShift environment running in your own
machine. I decided to use OpenShift Origin, so the instructions below are tailored for that
environment, but similar instructions could be used with Minishift.
3. Install Anaconda for Python 3, this is required to run Jupyter notebook for plotting.
Demo Domain
Once the set up is complete, it’s time to talk about the demos before we run them.
Both demos shown below work with the same application domain: swiss rail transport systems. In this domain, we differentiate between physical stations, trains, station boards which are located in stations, and finally stops, which are individual entries in station boards.
Real Time Demo
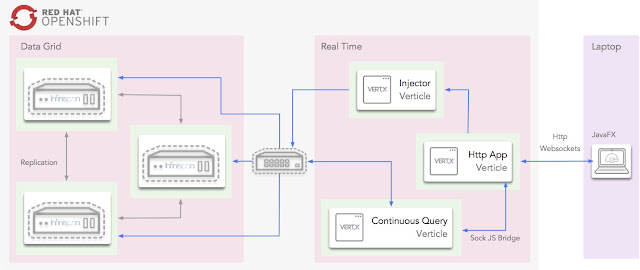
The first demo is about working with real-time data from station boards around the country and presenting a centralised dashboard of delayed trains around the country. The following diagrams shows how the following components interact with each other to achieve this:
Infinispan, which provides the in-memory data grid storage, and Vert.x, which provides the glue for the centralised delayed dashboard to interact with Infinispan, all run within OpenShift cloud.
Within the cloud, the Injector verticle cycles through station board data and injects it into Infinispan. Also within the cloud, a Vert.x verticle that uses Infinispan’s Continuous Query to listen for station board entries that are delayed, and these are pushed into the Vert.x event bus, which in turn, via a SockJS bridge, get consumed via WebSockets from the dashboard. The centralised dashboards is written with JavaFX and runs outside the cloud.
To run the demo, do the following:
1. Start OpenShift Origin if you’ve not already done so:
oc cluster up --public-hostname=127.0.0.1
2. Deploy all the OpenShift cloud components:
cd ~/swiss-transport-datagrid
./deploy-all.sh
3. Open the OpenShift console and verify that all pods are up.
4. Load github repository into your favourite IDE and run
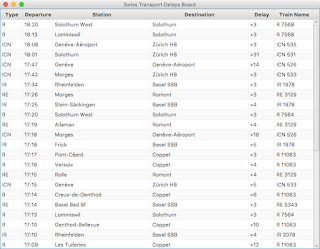
delays.query.continuous.fx.FxApp Java FX application. This will load the
centralised dashboard. Within seconds delayed trains will start appearing. For example:
Analytics Demo
The first demo is focused on how you can use Infinispan for doing offline analytics. In particular, this demo tries to answer the following question:
Q. What is the time of the day when there is the biggest ratio of delayed trains?
Once again, this demo runs on top of OpenShift cloud, uses Infinispan as in-memory data grid for storage and Vert.x for glueing components together.
To answer this question, Infinispan data grid will be loaded with 3 weeks worth of data from station boards using a Vert.x verticle. Once the data is loaded, the Jupyter notebook will invoke an HTTP restful endpoint which will invoke an Vert.x verticle called AnalyticsVerticle.
This verticle will invoke a remote server task which will use Infinispan Distributed Java Streams to calculate the two pieces of information required to answer the question: per hour, how many trains are going through the system, and out of those, how many are delayed.
An important aspect to bear in mind about this server tasks is that it will only be executed in one of the nodes in the cluster. It does not matter which one. In turn, this node will will ship the lambdas required to do the computation to each of the nodes so that they can executed against their local data. The other nodes will reply with the results and the node where the server task was invoked will aggregate the results.
The results will be sent back to the originating invoker, the Jupyter notebook which will plot the results. The following diagrams shows how the following components interact with each other to achieve this:
Here is the demo step-by-step guide:
1. Start OpenShift Origin and deploy all components as shown in previous demo.
2. Start the Jupyter notebook:
cd ~/swiss-transport-datagrid/analytics/analytics-jupyter
~/anaconda/bin/jupyter notebook
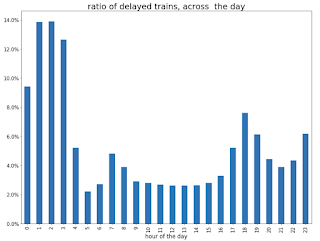
3. Once the notebook opens, click open live-demo.ipynb notebook and execute each of the cells in order. You should end up seeing a plot like this:
So, the answer to the question:
Q. What is the time of the day when there is the biggest ratio of delayed trains?
https://www.blogger.com/blogger.g?blogID=5717179571414330874https://www.blogger.com/blogger.g?blogID=5717179571414330874[]https://www.blogger.com/blogger.g?blogID=5717179571414330874
is 2am! That’s because last connecting trains of the day wait for each other to avoid leaving passengers stranded.
Conclusion
This has been a summary of the demos that I presented at Great Indian Developer Summit with the intention of getting you running these demos as quickly as possible. The repository contains more detailed information of these demos. If there’s anything unclear or any of the instructions above are not working, please let us know!
Once again, a very special thanks to Alexandre Masselot for being the inspiration for these demos. Merci @Alex!!
Over the next few months we will be enhancing the demo and hopefully we’ll be able to do some more live demonstrations at other conferences.
Cheers,
Galder
Tags: conference demo
Monday, 24 April 2017
Learn about Infinispan at Great Indian Developer Summit
I’ve just arrived in India where I’ll be speaking about Infinispan, JBoss Data Grid and other related technologies in the Great Indian Developer Developer Summit in Bangalore. So if you’re attending and want to find out more how Infinispan can help your systems react to real-time data quickly, and see the cool stuff we have for data analytics, make sure you come!!
For more details, check the conference schedule :)
Cheers, Galder
Tags: conference
Tuesday, 04 April 2017
Infinispan coming to Devoxx France 2017
Infinispan will be present in Devoxx France from 5th to 7th April 2017. Emmanuel Bernard and myself will be speaking about in-memory data grid use cases with some cool demos around rail train transport (who doesn’t love trains?).
So, if you’re at Devoxx France, or considering going there, and want to find out more about in-memory data grids and Infinispan, make sure you come to our talk!!
Cheers, Galder
Tags: conference
Thursday, 15 December 2016
Thanks Soft-Shake and Devoxx Morocco!
Last month I presented about building functional reactive applications with Infinispan, Node.js and Elm at both Soft-Shake in Geneva (slides) and Devoxx Morocco (slides).
Thanks a lot to all the participants who attended the talks and thanks also to the organisers for accepting my talk. Both conferences were really enjoyable!
At Soft-Shake I managed to attend a few presentations, and the one that really stuck with me was the one from Alexandre Masselot on "Données CFF en temps réel: tribulations techniques dans la stack Big Data" (slides). It was a very interesting use case on doing big data with the information from the Swiss Rail system. Although there was no live demo, Alexandre gave the link to a repo where you can run stuff yourself. Very cool!
On top of that, I also attended a talk by Tom Bujok on Scaling Your Application Out. Tom happens to be an old friend who since I last met him has joined Hazelcast ;)
Shortly after Shoft-Shake I headed to Casablanca to speak at Devoxx Morocco. This was a fantastic conference with a lot of young attendees. The room was almost packed up for my talk and I got good reaction from the audience on both the talk and the live demo.
During the conference I also attended other talks, including a couple of Kubernetes talks by Ray Tsang, who is an Infinispan committer himself. In his presentations he uses a Kubernetes visualizer which is very cool and I’m hoping to use it in future presentations :)
No more conferences for this year, thanks to all who’ve attended Infinispan presentations throughout the year!
Cheers,
Galder
Tags: conference
